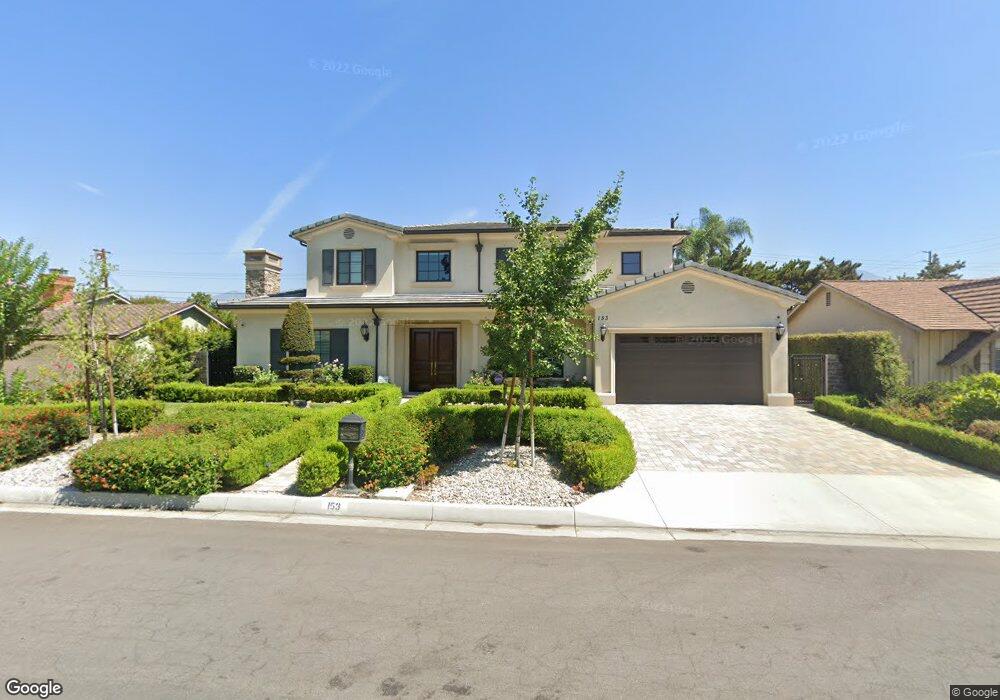
153 E Pamela Rd Arcadia, CA 91006
Estimated Value: $2,696,495 - $3,229,000
4
Beds
5
Baths
3,909
Sq Ft
$756/Sq Ft
Est. Value
About This Home
This home is located at 153 E Pamela Rd, Arcadia, CA 91006 and is currently estimated at $2,953,874, approximately $755 per square foot. 153 E Pamela Rd is a home located in Los Angeles County with nearby schools including Camino Grove Elementary School, Richard Henry Dana Middle School, and Arcadia High School.
Ownership History
Date
Name
Owned For
Owner Type
Purchase Details
Closed on
Jun 2, 2017
Sold by
Ap Royal Oak Llc
Bought by
Cheng Guilian
Current Estimated Value
Purchase Details
Closed on
May 23, 2017
Sold by
Huang Yonggen
Bought by
Cheng Guilian
Purchase Details
Closed on
Sep 3, 2014
Sold by
Yu Kenny
Bought by
Ap Royal Oak Llc
Home Financials for this Owner
Home Financials are based on the most recent Mortgage that was taken out on this home.
Original Mortgage
$432,000
Interest Rate
4.09%
Mortgage Type
Purchase Money Mortgage
Purchase Details
Closed on
May 1, 2014
Sold by
Cassleman Robert G
Bought by
Yu Kenny
Purchase Details
Closed on
Sep 23, 2002
Sold by
Cassleman Robert G and Ford Diane C
Bought by
Cassleman Robert G
Purchase Details
Closed on
Sep 18, 2000
Sold by
Cassleman Robert G and Ford Diane C
Bought by
Cassleman Robert G
Create a Home Valuation Report for This Property
The Home Valuation Report is an in-depth analysis detailing your home's value as well as a comparison with similar homes in the area
Home Values in the Area
Average Home Value in this Area
Purchase History
| Date | Buyer | Sale Price | Title Company |
|---|---|---|---|
| Cheng Guilian | $2,200,000 | Title 365 | |
| Cheng Guilian | -- | Title 365 | |
| Ap Royal Oak Llc | -- | Chicago Title Company | |
| Yu Kenny | $980,009 | Title 365 | |
| Cassleman Robert G | -- | -- | |
| Cassleman Robert G | -- | -- |
Source: Public Records
Mortgage History
| Date | Status | Borrower | Loan Amount |
|---|---|---|---|
| Previous Owner | Ap Royal Oak Llc | $432,000 |
Source: Public Records
Tax History
| Year | Tax Paid | Tax Assessment Tax Assessment Total Assessment is a certain percentage of the fair market value that is determined by local assessors to be the total taxable value of land and additions on the property. | Land | Improvement |
|---|---|---|---|---|
| 2025 | $28,077 | $2,553,283 | $1,508,759 | $1,044,524 |
| 2024 | $28,077 | $2,503,220 | $1,479,176 | $1,024,044 |
| 2023 | $27,486 | $2,454,138 | $1,450,173 | $1,003,965 |
| 2022 | $26,570 | $2,406,019 | $1,421,739 | $984,280 |
| 2021 | $26,084 | $2,358,843 | $1,393,862 | $964,981 |
| 2019 | $25,443 | $2,288,880 | $1,352,520 | $936,360 |
| 2018 | $24,816 | $2,244,000 | $1,326,000 | $918,000 |
| 2016 | $13,563 | $1,184,796 | $888,343 | $296,453 |
| 2015 | $13,327 | $1,167,000 | $875,000 | $292,000 |
| 2014 | $1,642 | $104,755 | $38,578 | $66,177 |
Source: Public Records
Map
Nearby Homes
- 185 E Norman Ave
- 1125 S 1st Ave
- 1825 Lee Ave
- 1431 S 6th Ave
- 1200 S Santa Anita Ave
- 1606 S 5th Ave
- 1780 S Santa Anita Ave
- 1118 S 4th Ave
- 21 W Camino Real Ave
- 1100 S 4th Ave
- 56 E Duarte Rd Unit 318
- 56 E Duarte Rd Unit 418
- 519 Connie Rae Way
- 315 E Las Flores Ave
- 1118 S 6th Ave
- 1227 S 8th Ave
- 910 S 5th Ave
- 57 Alice St Unit A
- 151 E Longden Ave
- 1318 S 8th Ave
- 147 E Pamela Rd
- 161 E Pamela Rd
- 152 Altern St
- 146 Altern St
- 152 E Pamela Rd
- 165 E Pamela Rd
- 141 E Pamela Rd
- 1421 S 2nd Ave
- 160 E Pamela Rd
- 146 E Pamela Rd
- 140 Altern St
- 166 E Pamela Rd
- 140 E Pamela Rd
- 1415 S 2nd Ave
- 1525 S 2nd Ave
- 153 Altern St
- 147 Altern St
- 141 Altern St
- 1501 Greenfield Ave
- 1407 S 2nd Ave
Your Personal Tour Guide
Ask me questions while you tour the home.