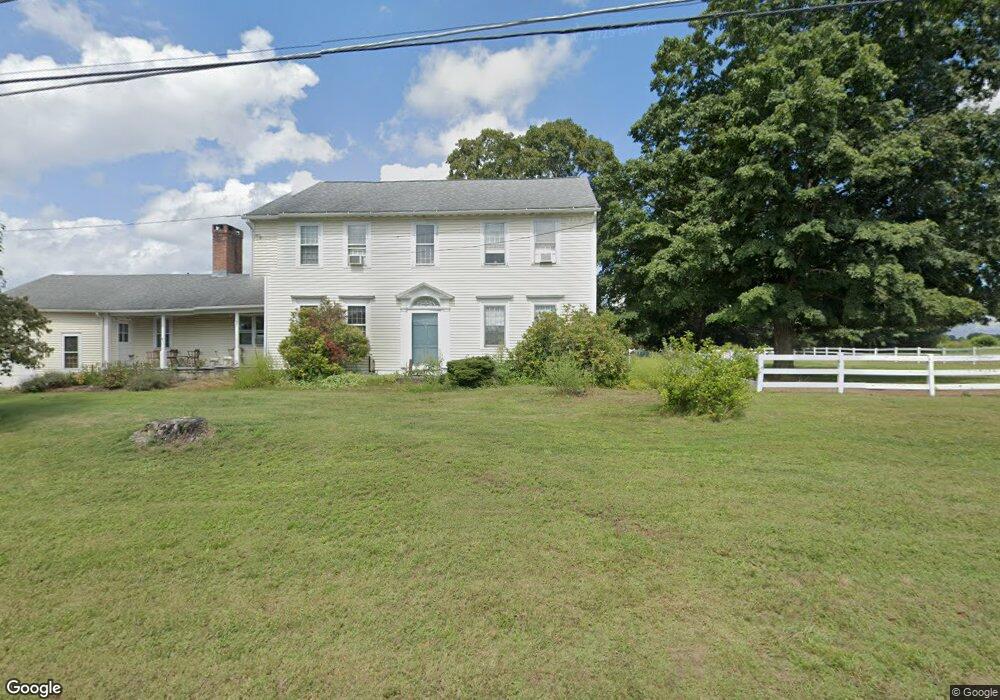
153 Melrose Rd Broad Brook, CT 06016
Estimated Value: $455,000 - $574,000
5
Beds
2
Baths
3,243
Sq Ft
$161/Sq Ft
Est. Value
About This Home
This home is located at 153 Melrose Rd, Broad Brook, CT 06016 and is currently estimated at $522,367, approximately $161 per square foot. 153 Melrose Rd is a home located in Hartford County with nearby schools including Broad Brook Elementary School, East Windsor Middle School, and East Windsor High School.
Ownership History
Date
Name
Owned For
Owner Type
Purchase Details
Closed on
Oct 4, 2011
Sold by
Broughal Ingrid L
Bought by
Neill Ian R and Neill Frances B
Current Estimated Value
Home Financials for this Owner
Home Financials are based on the most recent Mortgage that was taken out on this home.
Original Mortgage
$219,200
Interest Rate
4.15%
Purchase Details
Closed on
Jul 9, 2002
Sold by
Korb William and Korb Candace
Bought by
Broughal Donald and Broughal Ingrid
Create a Home Valuation Report for This Property
The Home Valuation Report is an in-depth analysis detailing your home's value as well as a comparison with similar homes in the area
Home Values in the Area
Average Home Value in this Area
Purchase History
| Date | Buyer | Sale Price | Title Company |
|---|---|---|---|
| Neill Ian R | $274,000 | -- | |
| Broughal Ingrid L | -- | -- | |
| Broughal Donald | $392,000 | -- |
Source: Public Records
Mortgage History
| Date | Status | Borrower | Loan Amount |
|---|---|---|---|
| Open | Broughal Donald | $240,000 | |
| Closed | Broughal Donald | $219,200 | |
| Previous Owner | Broughal Donald | $220,000 |
Source: Public Records
Tax History
| Year | Tax Paid | Tax Assessment Tax Assessment Total Assessment is a certain percentage of the fair market value that is determined by local assessors to be the total taxable value of land and additions on the property. | Land | Improvement |
|---|---|---|---|---|
| 2025 | $8,358 | $315,500 | $74,280 | $241,220 |
| 2024 | $7,702 | $313,600 | $74,280 | $239,320 |
| 2023 | $5,997 | $174,930 | $53,770 | $121,160 |
| 2022 | $6,014 | $174,930 | $53,770 | $121,160 |
| 2021 | $6,035 | $174,930 | $53,770 | $121,160 |
| 2020 | $6,074 | $174,930 | $53,770 | $121,160 |
| 2019 | $5,991 | $174,930 | $53,770 | $121,160 |
| 2018 | $5,930 | $174,930 | $53,770 | $121,160 |
| 2017 | $6,381 | $194,730 | $60,430 | $134,300 |
| 2016 | $6,023 | $194,730 | $60,430 | $134,300 |
| 2015 | $5,902 | $194,730 | $60,430 | $134,300 |
| 2014 | $5,799 | $194,730 | $60,430 | $134,300 |
Source: Public Records
Map
Nearby Homes
Your Personal Tour Guide
Ask me questions while you tour the home.