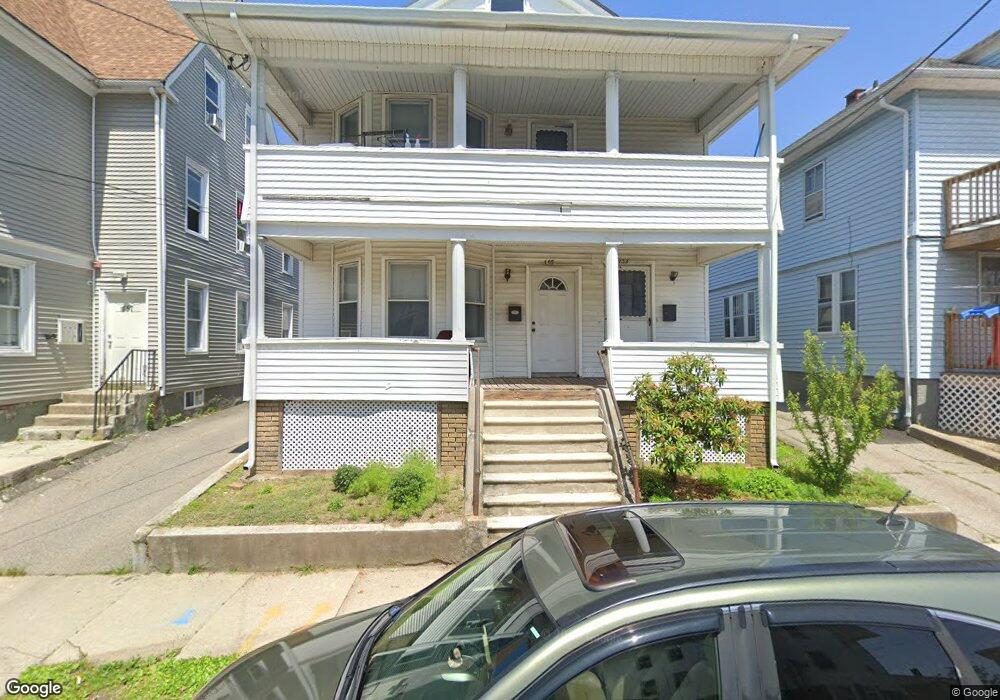
153 Porter St Providence, RI 02905
Washington Park NeighborhoodEstimated Value: $484,473 - $568,000
4
Beds
2
Baths
2,486
Sq Ft
$216/Sq Ft
Est. Value
About This Home
This home is located at 153 Porter St, Providence, RI 02905 and is currently estimated at $537,118, approximately $216 per square foot. 153 Porter St is a home located in Providence County with nearby schools including Highlander Charter School and The Hope Academy.
Ownership History
Date
Name
Owned For
Owner Type
Purchase Details
Closed on
Jan 31, 2003
Sold by
Chan Phin and Kim Son
Bought by
Lok Mao and Hang Mom
Current Estimated Value
Home Financials for this Owner
Home Financials are based on the most recent Mortgage that was taken out on this home.
Original Mortgage
$135,867
Outstanding Balance
$57,731
Interest Rate
6.09%
Mortgage Type
Purchase Money Mortgage
Estimated Equity
$479,387
Create a Home Valuation Report for This Property
The Home Valuation Report is an in-depth analysis detailing your home's value as well as a comparison with similar homes in the area
Home Values in the Area
Average Home Value in this Area
Purchase History
| Date | Buyer | Sale Price | Title Company |
|---|---|---|---|
| Lok Mao | $138,000 | -- |
Source: Public Records
Mortgage History
| Date | Status | Borrower | Loan Amount |
|---|---|---|---|
| Open | Lok Mao | $135,867 |
Source: Public Records
Tax History
| Year | Tax Paid | Tax Assessment Tax Assessment Total Assessment is a certain percentage of the fair market value that is determined by local assessors to be the total taxable value of land and additions on the property. | Land | Improvement |
|---|---|---|---|---|
| 2025 | $3,444 | $456,200 | $120,000 | $336,200 |
| 2024 | $5,711 | $311,200 | $76,000 | $235,200 |
| 2023 | $5,711 | $311,200 | $76,000 | $235,200 |
| 2022 | $5,539 | $311,200 | $76,000 | $235,200 |
| 2021 | $4,357 | $177,400 | $33,600 | $143,800 |
| 2020 | $4,357 | $177,400 | $33,600 | $143,800 |
| 2019 | $4,357 | $177,400 | $33,600 | $143,800 |
| 2018 | $3,474 | $108,700 | $30,500 | $78,200 |
| 2017 | $3,474 | $108,700 | $30,500 | $78,200 |
| 2016 | $3,474 | $108,700 | $30,500 | $78,200 |
| 2015 | $3,154 | $95,300 | $30,500 | $64,800 |
| 2014 | $3,216 | $95,300 | $30,500 | $64,800 |
| 2013 | $3,216 | $95,300 | $30,500 | $64,800 |
Source: Public Records
Map
Nearby Homes
Your Personal Tour Guide
Ask me questions while you tour the home.