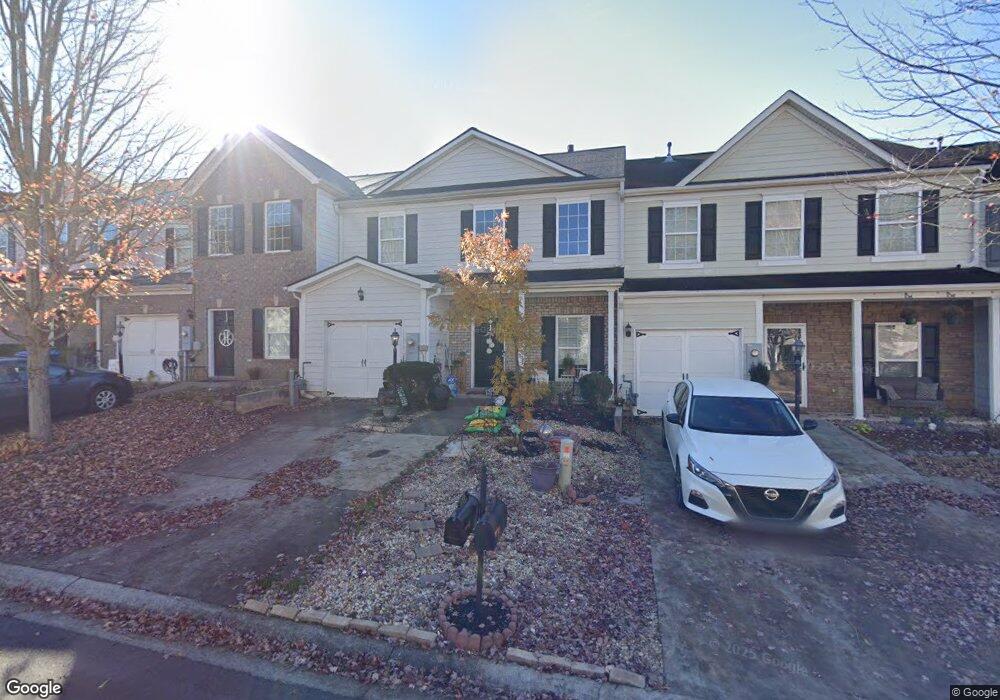
153 Spring Way Square Unit 56 Canton, GA 30114
Estimated Value: $315,000 - $324,139
3
Beds
3
Baths
1,856
Sq Ft
$172/Sq Ft
Est. Value
About This Home
This home is located at 153 Spring Way Square Unit 56, Canton, GA 30114 and is currently estimated at $319,570, approximately $172 per square foot. 153 Spring Way Square Unit 56 is a home located in Cherokee County with nearby schools including Liberty Elementary School, Freedom Middle School, and Cherokee High School.
Ownership History
Date
Name
Owned For
Owner Type
Purchase Details
Closed on
Dec 30, 2016
Sold by
Springemann Travis Lee
Bought by
Copeland Janice M
Current Estimated Value
Purchase Details
Closed on
Jul 16, 2013
Sold by
Lalama Richard A
Bought by
Springemann Travis Lee
Purchase Details
Closed on
Aug 31, 2009
Sold by
Bank Of North Ga
Bought by
Lalama Richard A and Lalama Terry L
Purchase Details
Closed on
Jun 2, 2009
Sold by
Homeland Legacy Builders
Bought by
Bank Of North Ga
Create a Home Valuation Report for This Property
The Home Valuation Report is an in-depth analysis detailing your home's value as well as a comparison with similar homes in the area
Home Values in the Area
Average Home Value in this Area
Purchase History
| Date | Buyer | Sale Price | Title Company |
|---|---|---|---|
| Copeland Janice M | $156,000 | -- | |
| Copeland Janice M | $156,000 | -- | |
| Springemann Travis Lee | $121,000 | -- | |
| Springemann Travis Lee | $121,000 | -- | |
| Lalama Richard A | $104,000 | -- | |
| Lalama Richard A | $104,000 | -- | |
| Bank Of North Ga | $120,000 | -- | |
| Bank Of North Ga | $120,000 | -- |
Source: Public Records
Tax History
| Year | Tax Paid | Tax Assessment Tax Assessment Total Assessment is a certain percentage of the fair market value that is determined by local assessors to be the total taxable value of land and additions on the property. | Land | Improvement |
|---|---|---|---|---|
| 2025 | $3,088 | $130,032 | $26,000 | $104,032 |
| 2024 | $638 | $120,092 | $24,000 | $96,092 |
| 2023 | $611 | $120,632 | $24,000 | $96,632 |
| 2022 | $656 | $101,368 | $20,000 | $81,368 |
| 2021 | $316 | $78,268 | $17,200 | $61,068 |
| 2020 | $876 | $76,200 | $15,200 | $61,000 |
| 2019 | $316 | $71,040 | $13,600 | $57,440 |
| 2018 | $871 | $64,880 | $12,000 | $52,880 |
| 2017 | $1,989 | $147,700 | $10,400 | $48,680 |
| 2016 | $1,433 | $139,200 | $10,400 | $45,280 |
| 2015 | $1,276 | $122,900 | $9,200 | $39,960 |
| 2014 | $1,199 | $115,200 | $9,200 | $36,880 |
Source: Public Records
Map
Nearby Homes
- 230 Valley Crossing
- 288 Valley Crossing
- 116 Spring Way Square
- 112 Spring Way Square
- 107 Hidden Lake Cir
- 116 Hidden Lake Cir
- 342 Hidden Creek Ln
- 150 Hidden Lake Cir
- 922 Gardenia Curve
- 808 Inkberry Rd
- 107 Nacoochee Way
- 729 Mountain Laurel Dr
- 151 Ilex Dr
- 291 Springs Crossing
- 188 Ilex Dr
- 190 Ilex Dr
- 114 Oleander Way
- 255 Osmanthus Way
- 304 Meadows Ln Unit 2
- 329 Meadows Ln
- 153 Spring Way Square
- 151 Spring Way Square Unit 57
- 151 Spring Way Square
- 155 Spring Way Square Unit 55
- 155 Spring Way Square
- 149 Spring Way Square Unit 58
- 149 Spring Way Square
- 157 Spring Way Square Unit 54
- 157 Spring Way Square
- 147 Spring Way Square Unit 59
- 147 Spring Way Square
- 256 Valley Crossing Unit 111
- 256 Valley Crossing
- 258 Valley Crossing Unit 112
- 258 Valley Crossing
- 252 Valley Crossing
- 252 Valley Crossing Unit 252
- 145 Sring Square Way Unit 60
- 161 Spring Way Square Unit 258
- 161 Spring Way Square
Your Personal Tour Guide
Ask me questions while you tour the home.