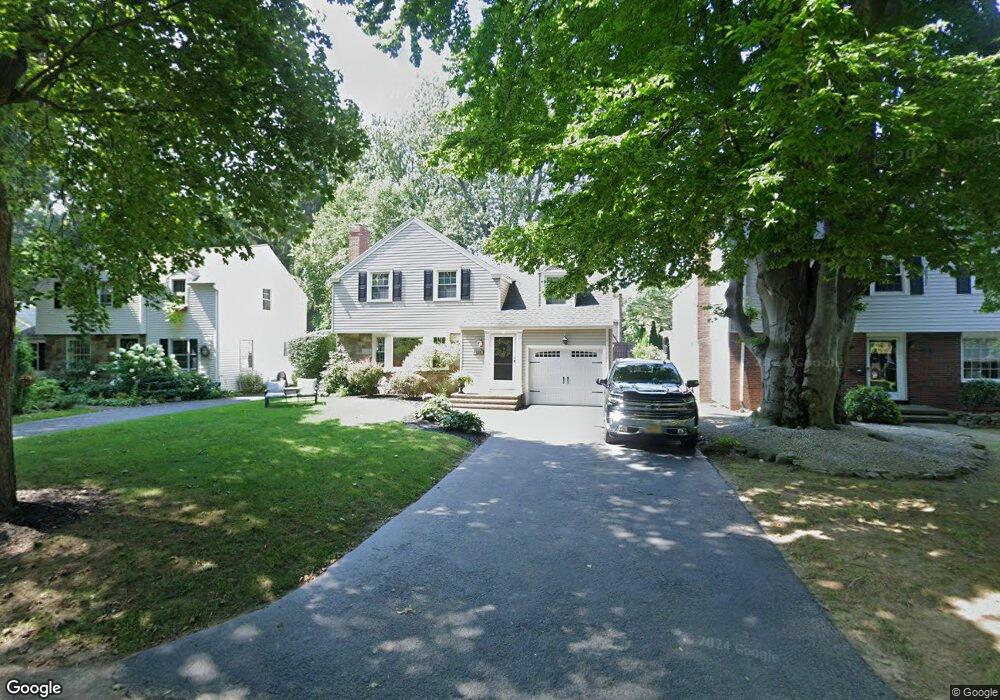
153 Valley View Crescent Rochester, NY 14617
Estimated Value: $292,856 - $337,000
3
Beds
2
Baths
1,693
Sq Ft
$183/Sq Ft
Est. Value
About This Home
This home is located at 153 Valley View Crescent, Rochester, NY 14617 and is currently estimated at $310,464, approximately $183 per square foot. 153 Valley View Crescent is a home located in Monroe County with nearby schools including Dake Junior High School, Irondequoit High School, and Holy Cross School.
Ownership History
Date
Name
Owned For
Owner Type
Purchase Details
Closed on
Apr 1, 2010
Sold by
Vangorder Thomas D and Van Gorder Alicia M
Bought by
Christianson Andrew J and Simonezzi Alexis N
Current Estimated Value
Home Financials for this Owner
Home Financials are based on the most recent Mortgage that was taken out on this home.
Original Mortgage
$120,000
Outstanding Balance
$79,686
Interest Rate
4.94%
Mortgage Type
New Conventional
Estimated Equity
$230,778
Purchase Details
Closed on
Sep 18, 2007
Sold by
Trimble Alicia
Bought by
Palmeri Alicia
Home Financials for this Owner
Home Financials are based on the most recent Mortgage that was taken out on this home.
Original Mortgage
$130,500
Interest Rate
6.59%
Mortgage Type
New Conventional
Purchase Details
Closed on
Nov 19, 2004
Sold by
Trimble Steven L
Bought by
Trimble Alicia M
Purchase Details
Closed on
Mar 21, 2001
Sold by
Flora Jack T
Bought by
Floria Jack T
Create a Home Valuation Report for This Property
The Home Valuation Report is an in-depth analysis detailing your home's value as well as a comparison with similar homes in the area
Home Values in the Area
Average Home Value in this Area
Purchase History
| Date | Buyer | Sale Price | Title Company |
|---|---|---|---|
| Christianson Andrew J | $150,000 | None Available | |
| Palmeri Alicia | -- | -- | |
| Trimble Alicia M | -- | -- | |
| Floria Jack T | -- | -- |
Source: Public Records
Mortgage History
| Date | Status | Borrower | Loan Amount |
|---|---|---|---|
| Open | Christianson Andrew J | $120,000 | |
| Previous Owner | Palmeri Alicia | $130,500 |
Source: Public Records
Tax History Compared to Growth
Tax History
| Year | Tax Paid | Tax Assessment Tax Assessment Total Assessment is a certain percentage of the fair market value that is determined by local assessors to be the total taxable value of land and additions on the property. | Land | Improvement |
|---|---|---|---|---|
| 2024 | $6,515 | $194,000 | $39,000 | $155,000 |
| 2023 | $6,261 | $194,000 | $39,000 | $155,000 |
| 2022 | $7,533 | $153,800 | $32,400 | $121,400 |
| 2021 | $7,447 | $153,800 | $32,400 | $121,400 |
| 2020 | $6,526 | $153,800 | $32,400 | $121,400 |
| 2019 | $5,554 | $153,800 | $32,400 | $121,400 |
| 2018 | $6,237 | $153,800 | $32,400 | $121,400 |
| 2017 | $2,959 | $133,000 | $20,000 | $113,000 |
| 2016 | $5,554 | $133,000 | $20,000 | $113,000 |
| 2015 | -- | $133,000 | $20,000 | $113,000 |
| 2014 | -- | $133,000 | $20,000 | $113,000 |
Source: Public Records
Map
Nearby Homes
- 318 Thomas Ave
- 55 Harbor Hill Dr
- 120-122 Afton St
- 20 Afton St
- 197 Eaton Rd
- 176 Harvington Dr
- 6 Calvin Rd
- 21 Dodridge St
- 54 Leroy St
- 388 Eaton Rd
- 188 Weston Rd
- 78 Ontario View St
- 87 Leander Rd
- 116 Charing Rd
- 0 Pinegrove Ave
- 182 Chesterfield Dr
- 62 Shorewood Dr
- 117 Shorewood Dr
- 69 Couchman Ave
- 17 Leander Rd
- 145 Valley View Crescent
- 159 Valley View Crescent
- 324 van Voorhis Ave
- 139 Valley View Crescent
- 318 van Voorhis Ave
- 328 van Voorhis Ave
- 160 Valley View Crescent
- 181 Valley View Crescent
- 336 van Voorhis Ave
- 114 Valley View Crescent
- 346 van Voorhis Ave
- 115 Valley View Crescent
- 180 Valley View Crescent
- 125 Valley View Crescent
- 94 Valley View Crescent
- 105 Valley View Crescent
- 188 Valley View Crescent
- 312 van Voorhis Ave
- 399 Sagamore Dr
- 407 Sagamore Dr