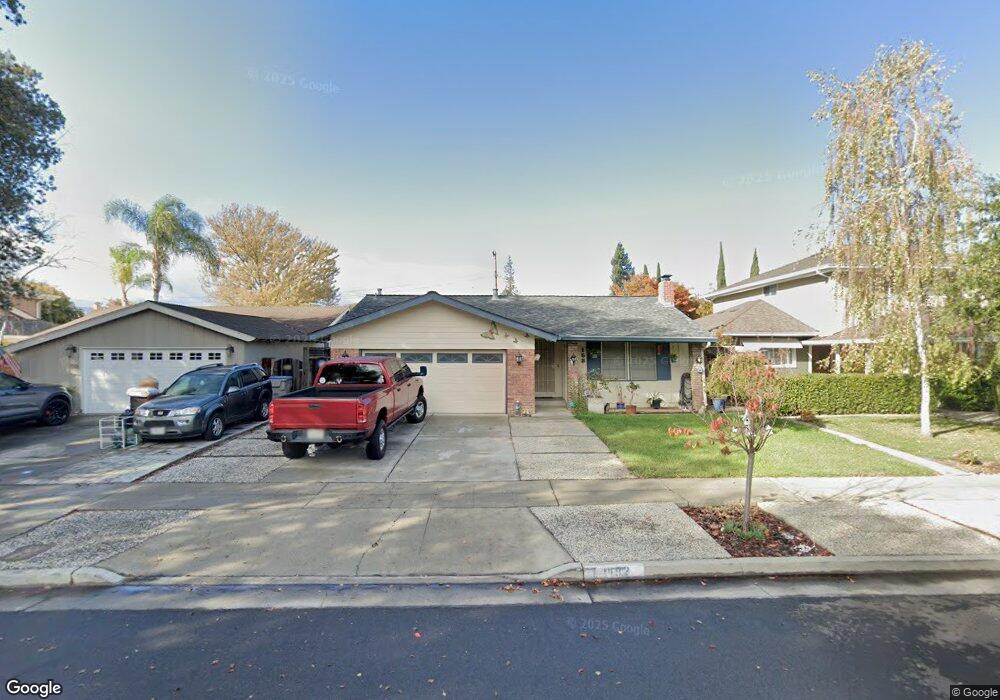
153 Venado Way San Jose, CA 95123
Anderson East NeighborhoodEstimated Value: $1,337,462 - $1,477,000
4
Beds
2
Baths
1,120
Sq Ft
$1,267/Sq Ft
Est. Value
About This Home
This home is located at 153 Venado Way, San Jose, CA 95123 and is currently estimated at $1,418,866, approximately $1,266 per square foot. 153 Venado Way is a home located in Santa Clara County with nearby schools including Alex Anderson Elementary School, Bernal Intermediate School, and Oak Grove High School.
Ownership History
Date
Name
Owned For
Owner Type
Purchase Details
Closed on
Sep 19, 2012
Sold by
Ong Steven Nhu
Bought by
Ong Cathy Nguyen
Current Estimated Value
Purchase Details
Closed on
Mar 27, 2001
Sold by
Trapani Christopher and Trapani Kirsten M
Bought by
Nguyen Hieu Trong
Home Financials for this Owner
Home Financials are based on the most recent Mortgage that was taken out on this home.
Original Mortgage
$275,000
Interest Rate
7.06%
Purchase Details
Closed on
Jul 7, 1999
Sold by
Christopher Trapani and Christopher Kirsten M
Bought by
Trapani Christopher A and Trapani Kirsten M
Purchase Details
Closed on
Dec 18, 1997
Sold by
Trapani Marko J
Bought by
Trapani Christopher and Trapani Kirsten M
Home Financials for this Owner
Home Financials are based on the most recent Mortgage that was taken out on this home.
Original Mortgage
$224,000
Interest Rate
7.62%
Create a Home Valuation Report for This Property
The Home Valuation Report is an in-depth analysis detailing your home's value as well as a comparison with similar homes in the area
Home Values in the Area
Average Home Value in this Area
Purchase History
| Date | Buyer | Sale Price | Title Company |
|---|---|---|---|
| Ong Cathy Nguyen | -- | None Available | |
| Ong Cathy Nguyen | -- | None Available | |
| Nguyen Hieu Trong | $455,000 | North American Title Co | |
| Trapani Christopher A | -- | -- | |
| Trapani Christopher | $12,500 | Old Republic Title Company | |
| Trapani Marko J | -- | Old Republic Title Company | |
| Trapani Christopher | $280,000 | Old Republic Title Company |
Source: Public Records
Mortgage History
| Date | Status | Borrower | Loan Amount |
|---|---|---|---|
| Previous Owner | Nguyen Hieu Trong | $275,000 | |
| Previous Owner | Trapani Christopher | $224,000 |
Source: Public Records
Tax History Compared to Growth
Tax History
| Year | Tax Paid | Tax Assessment Tax Assessment Total Assessment is a certain percentage of the fair market value that is determined by local assessors to be the total taxable value of land and additions on the property. | Land | Improvement |
|---|---|---|---|---|
| 2025 | $7,934 | $523,347 | $277,065 | $246,282 |
| 2024 | $7,934 | $513,086 | $271,633 | $241,453 |
| 2023 | $7,794 | $503,026 | $266,307 | $236,719 |
| 2022 | $7,657 | $493,164 | $261,086 | $232,078 |
| 2021 | $7,517 | $483,495 | $255,967 | $227,528 |
| 2020 | $7,333 | $478,538 | $253,343 | $225,195 |
| 2019 | $7,153 | $469,156 | $248,376 | $220,780 |
| 2018 | $7,093 | $459,957 | $243,506 | $216,451 |
| 2017 | $6,993 | $450,939 | $238,732 | $212,207 |
| 2016 | $6,655 | $442,098 | $234,051 | $208,047 |
| 2015 | $6,503 | $435,458 | $230,536 | $204,922 |
| 2014 | $5,859 | $426,929 | $226,021 | $200,908 |
Source: Public Records
Map
Nearby Homes
- 5687 Beswick Dr
- 5555 Makati Cir Unit 208
- 5457 Makati Cir
- 5586 Makati Cir
- 195 Blossom Hill Rd Unit 242
- 195 Blossom Hill Rd Unit 118
- 195 Blossom Hill Rd Unit 276
- 165 Blossom Hill Rd Unit 113
- 212 Belden Dr
- 5696 Makati Cir Unit G
- 5701 Makati Cir Unit C
- 233 Omira Dr
- 5693 Makati Cir Unit D
- 259 Omira Dr
- 0 Deer Valley Rd Unit 225017975
- 5399 Garrison Cir
- 71 Hayes Ave
- 5865 Paddon Cir
- 5532 Spinnaker Dr Unit 2
- 5503 Eagles Ln Unit 2