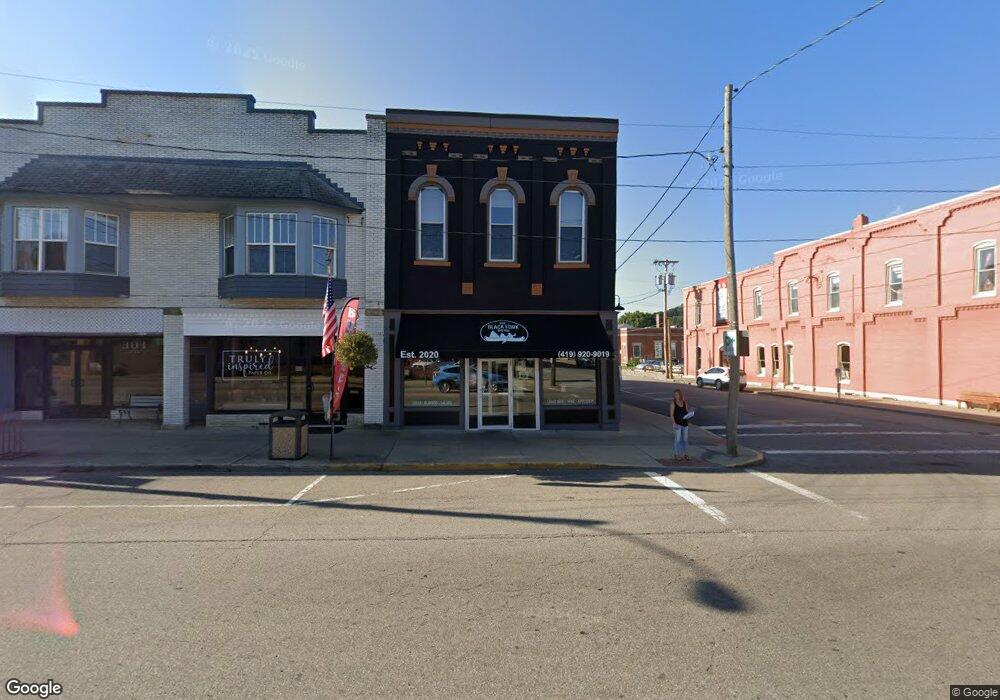
153 W Main St Loudonville, OH 44842
Estimated Value: $451,407
--
Bed
--
Bath
4,532
Sq Ft
$100/Sq Ft
Est. Value
About This Home
This home is located at 153 W Main St, Loudonville, OH 44842 and is currently estimated at $451,407, approximately $99 per square foot. 153 W Main St is a home located in Ashland County with nearby schools including Budd Elementary School, McMullen Elementary School, and Loudonville High School.
Ownership History
Date
Name
Owned For
Owner Type
Purchase Details
Closed on
Sep 19, 2023
Sold by
Black Fork Properties Llc
Bought by
Bfbistro Property Management Llc
Current Estimated Value
Home Financials for this Owner
Home Financials are based on the most recent Mortgage that was taken out on this home.
Original Mortgage
$95,000
Outstanding Balance
$93,075
Interest Rate
6.96%
Estimated Equity
$358,332
Purchase Details
Closed on
Feb 21, 2019
Sold by
Fll Llc
Bought by
Black Fork Properties Llc
Purchase Details
Closed on
May 19, 2010
Purchase Details
Closed on
Apr 13, 2010
Purchase Details
Closed on
Feb 22, 2002
Sold by
Wacker Joanne G
Purchase Details
Closed on
Dec 3, 1991
Bought by
Wacker Joanne G
Create a Home Valuation Report for This Property
The Home Valuation Report is an in-depth analysis detailing your home's value as well as a comparison with similar homes in the area
Home Values in the Area
Average Home Value in this Area
Purchase History
| Date | Buyer | Sale Price | Title Company |
|---|---|---|---|
| Bfbistro Property Management Llc | $380,000 | None Listed On Document | |
| Black Fork Properties Llc | $209,000 | Attorney Only | |
| -- | $85,000 | -- | |
| -- | -- | -- | |
| -- | $145,000 | -- | |
| Wacker Joanne G | $70,000 | -- |
Source: Public Records
Mortgage History
| Date | Status | Borrower | Loan Amount |
|---|---|---|---|
| Open | Bfbistro Property Management Llc | $95,000 | |
| Open | Bfbistro Property Management Llc | $289,700 |
Source: Public Records
Tax History Compared to Growth
Tax History
| Year | Tax Paid | Tax Assessment Tax Assessment Total Assessment is a certain percentage of the fair market value that is determined by local assessors to be the total taxable value of land and additions on the property. | Land | Improvement |
|---|---|---|---|---|
| 2024 | $2,905 | $56,520 | $4,290 | $52,230 |
| 2023 | $2,905 | $56,520 | $4,290 | $52,230 |
| 2022 | $2,922 | $53,830 | $4,090 | $49,740 |
| 2021 | $2,995 | $53,830 | $4,090 | $49,740 |
| 2020 | $2,863 | $53,830 | $4,090 | $49,740 |
| 2019 | $2,565 | $46,010 | $4,000 | $42,010 |
| 2018 | $2,612 | $46,010 | $4,000 | $42,010 |
| 2017 | $2,566 | $46,010 | $4,000 | $42,010 |
| 2016 | $2,566 | $46,010 | $4,000 | $42,010 |
| 2015 | $2,543 | $46,010 | $4,000 | $42,010 |
| 2013 | $2,452 | $45,940 | $3,800 | $42,140 |
Source: Public Records
Map
Nearby Homes
- 316 E Campbell St
- 333 E Campbell St
- 524 N Union St
- 526 E Campbell St
- 518 Snyder Dr
- 723 Pearl Dr
- 500 Stone Meadow Cir
- 1406 Pearl Dr
- 2818 Township Road 2812
- 6620 Township Road 451
- 0 County Road 917
- 6913 County Road 22
- 3317 Township Road 539
- 136 Bridge St
- 14602 Township Road 469
- 14355 Township Road 467
- 78 Forest Hill Rd
- 609 Ohio 95
- 7129 Township Road 466
- 13636 Township Road 471