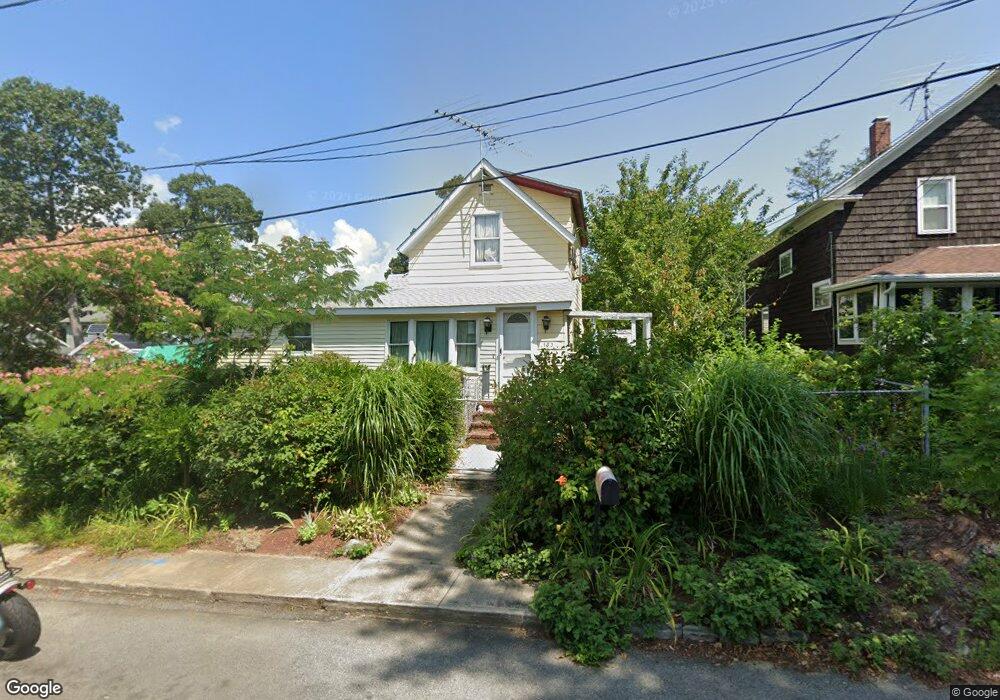
153 Wilson Ave Warwick, RI 02889
Oakland Beach NeighborhoodEstimated Value: $339,011 - $357,000
3
Beds
1
Bath
1,116
Sq Ft
$314/Sq Ft
Est. Value
About This Home
This home is located at 153 Wilson Ave, Warwick, RI 02889 and is currently estimated at $350,253, approximately $313 per square foot. 153 Wilson Ave is a home located in Kent County with nearby schools including Saint Kevin School and Bishop Hendricken High School.
Ownership History
Date
Name
Owned For
Owner Type
Purchase Details
Closed on
Jun 1, 1993
Sold by
Belleville Brenda A and Belleville Wendy
Bought by
Major Bruce E and Major Cheryl
Current Estimated Value
Home Financials for this Owner
Home Financials are based on the most recent Mortgage that was taken out on this home.
Original Mortgage
$85,000
Interest Rate
7.41%
Mortgage Type
Purchase Money Mortgage
Create a Home Valuation Report for This Property
The Home Valuation Report is an in-depth analysis detailing your home's value as well as a comparison with similar homes in the area
Home Values in the Area
Average Home Value in this Area
Purchase History
| Date | Buyer | Sale Price | Title Company |
|---|---|---|---|
| Major Bruce E | $84,000 | -- | |
| Major Bruce E | $84,000 | -- |
Source: Public Records
Mortgage History
| Date | Status | Borrower | Loan Amount |
|---|---|---|---|
| Open | Major Bruce E | $94,699 | |
| Closed | Major Bruce E | $110,000 | |
| Closed | Major Bruce E | $54,500 | |
| Closed | Major Bruce E | $85,000 |
Source: Public Records
Tax History Compared to Growth
Tax History
| Year | Tax Paid | Tax Assessment Tax Assessment Total Assessment is a certain percentage of the fair market value that is determined by local assessors to be the total taxable value of land and additions on the property. | Land | Improvement |
|---|---|---|---|---|
| 2025 | $3,715 | $292,500 | $116,400 | $176,100 |
| 2024 | $3,369 | $232,800 | $96,100 | $136,700 |
| 2023 | $3,303 | $232,800 | $96,100 | $136,700 |
| 2022 | $2,991 | $159,700 | $54,100 | $105,600 |
| 2021 | $2,991 | $159,700 | $54,100 | $105,600 |
| 2020 | $2,991 | $159,700 | $54,100 | $105,600 |
| 2019 | $2,991 | $159,700 | $54,100 | $105,600 |
| 2018 | $2,531 | $121,700 | $54,100 | $67,600 |
| 2017 | $2,579 | $127,400 | $54,100 | $73,300 |
| 2016 | $2,579 | $127,400 | $54,100 | $73,300 |
| 2015 | $2,785 | $134,200 | $69,600 | $64,600 |
| 2014 | $2,692 | $134,200 | $69,600 | $64,600 |
| 2013 | $2,656 | $134,200 | $69,600 | $64,600 |
Source: Public Records
Map
Nearby Homes