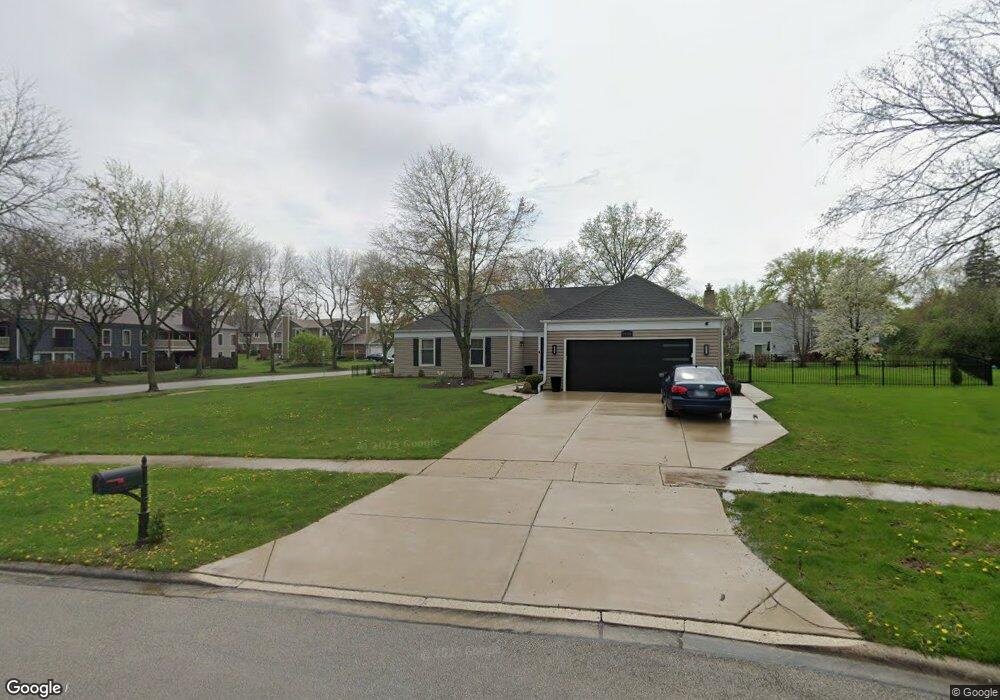
1530 County Farm Ct Wheaton, IL 60189
West Wheaton NeighborhoodEstimated Value: $530,000 - $599,000
4
Beds
3
Baths
2,180
Sq Ft
$264/Sq Ft
Est. Value
About This Home
This home is located at 1530 County Farm Ct, Wheaton, IL 60189 and is currently estimated at $575,474, approximately $263 per square foot. 1530 County Farm Ct is a home located in DuPage County with nearby schools including Madison Elementary School, Edison Middle School, and Wheaton Warrenville South High School.
Ownership History
Date
Name
Owned For
Owner Type
Purchase Details
Closed on
May 7, 2008
Sold by
Arbeiter Alvin H and Arbeiter Declaration O Alvin H
Bought by
Greene Gaston A and Greene Lezlie B
Current Estimated Value
Home Financials for this Owner
Home Financials are based on the most recent Mortgage that was taken out on this home.
Original Mortgage
$300,000
Outstanding Balance
$190,485
Interest Rate
5.93%
Mortgage Type
Purchase Money Mortgage
Estimated Equity
$384,989
Purchase Details
Closed on
Mar 7, 2001
Sold by
Strow Wallace F and Trust #H-248
Bought by
Arbeiter Alvin H and Alvin H Arbeiter Declaration Of Trust
Purchase Details
Closed on
Aug 8, 1997
Sold by
Leach Marie H and Biedke Leslie A
Bought by
Strow Wallace F and Trust #H-248
Purchase Details
Closed on
Jan 22, 1997
Sold by
Steffanus Leroy W and Steffanus Constance P
Bought by
Biedke Leslie A and Leach Marie H
Home Financials for this Owner
Home Financials are based on the most recent Mortgage that was taken out on this home.
Original Mortgage
$95,000
Interest Rate
7.66%
Create a Home Valuation Report for This Property
The Home Valuation Report is an in-depth analysis detailing your home's value as well as a comparison with similar homes in the area
Home Values in the Area
Average Home Value in this Area
Purchase History
| Date | Buyer | Sale Price | Title Company |
|---|---|---|---|
| Greene Gaston A | $340,000 | Atg | |
| Arbeiter Alvin H | $275,000 | First American Title Ins | |
| Strow Wallace F | -- | -- | |
| Biedke Leslie A | $225,000 | -- |
Source: Public Records
Mortgage History
| Date | Status | Borrower | Loan Amount |
|---|---|---|---|
| Open | Greene Gaston A | $300,000 | |
| Previous Owner | Biedke Leslie A | $95,000 |
Source: Public Records
Tax History
| Year | Tax Paid | Tax Assessment Tax Assessment Total Assessment is a certain percentage of the fair market value that is determined by local assessors to be the total taxable value of land and additions on the property. | Land | Improvement |
|---|---|---|---|---|
| 2024 | $10,328 | $175,812 | $36,579 | $139,233 |
| 2023 | $9,882 | $161,830 | $33,670 | $128,160 |
| 2022 | $9,491 | $147,650 | $31,820 | $115,830 |
| 2021 | $9,451 | $144,140 | $31,060 | $113,080 |
| 2020 | $9,419 | $142,800 | $30,770 | $112,030 |
| 2019 | $9,194 | $139,030 | $29,960 | $109,070 |
| 2018 | $10,103 | $145,060 | $35,680 | $109,380 |
| 2017 | $9,955 | $139,700 | $34,360 | $105,340 |
| 2016 | $9,825 | $134,120 | $32,990 | $101,130 |
| 2015 | $9,752 | $127,950 | $31,470 | $96,480 |
| 2014 | $8,178 | $106,550 | $20,240 | $86,310 |
| 2013 | $7,970 | $106,870 | $20,300 | $86,570 |
Source: Public Records
Map
Nearby Homes
- 1533 S County Farm Rd Unit 1-4
- 1S710 Shaffner Rd
- 1S728 Shaffner Rd
- 1442 Stonebridge Cir Unit I8
- 1462 Stonebridge Cir Unit F10
- 1420 Stonebridge Trail Unit 1-3
- 2099 Creekside Dr Unit 1-4
- 1612 Stonebridge Trail
- 2043 Spring Green Dr
- 1620 Hemstock Ave
- 1s050 Shaffner Rd
- 1974 Wexford Cir Unit 123
- 1605 Burning Trail
- 1601 W Wiesbrook Rd
- 27W327 Williams St
- 0S579 Robbins St
- Lot 17,18,19 Roosevelt Rd
- 27W0S Roosevelt Rd
- Lot 1 Foothill Dr
- 615 Polo Dr
- 1520 S County Farm Rd
- 1521 Mccormick Place
- 1542 S County Farm Rd
- 1505 Mccormick Place
- 1537 S County Farm Rd
- 1497 Mccormick Place
- 1539 S County Farm Rd
- 1500 County Farm Ct
- 1500 S County Farm Rd
- 1541 S County Farm Rd
- 1543 S County Farm Rd Unit 6
- 1496 County Farm Ct
- 1489 Mccormick Place
- 1545 S County Farm Rd
- 1526 Mccormick Place
- 1481 Belleau Woods Ct
- 1480 Belleau Woods Ct
- 1518 Mccormick Place
- 1510 Mccormick Place
Your Personal Tour Guide
Ask me questions while you tour the home.