Estimated Value: $371,570 - $417,000
3
Beds
2
Baths
2,178
Sq Ft
$182/Sq Ft
Est. Value
About This Home
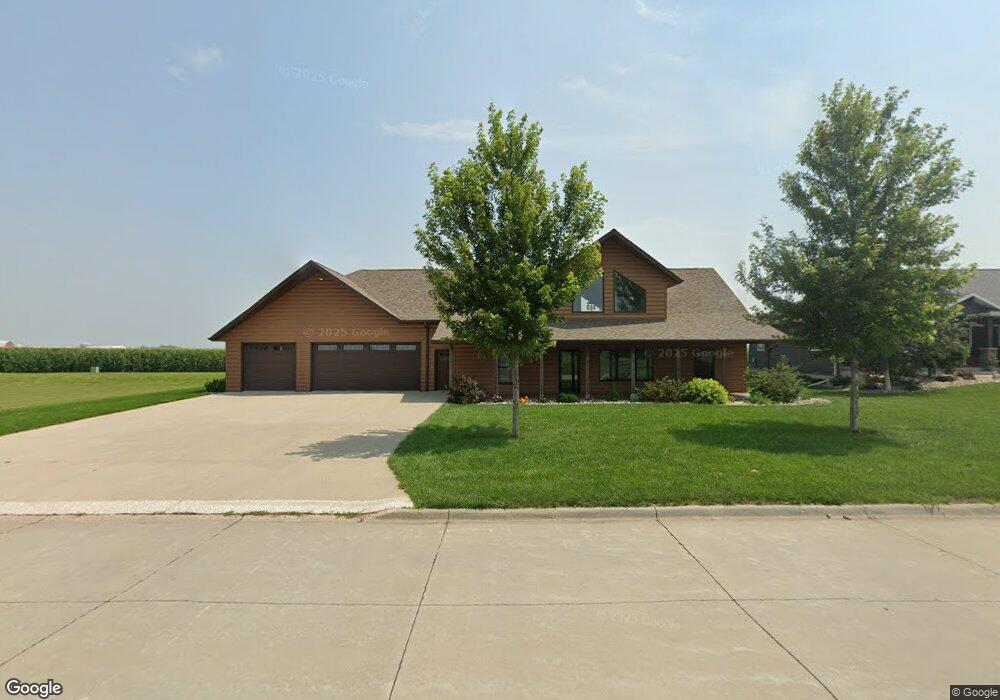
This home is located at 1530 Okey St, Hull, IA 51239 and is currently estimated at $395,893, approximately $181 per square foot. 1530 Okey St is a home located in Sioux County with nearby schools including Boyden-Hull Elementary School, Boyden-Hull High School, and Hull Christian School.
Ownership History
Date
Name
Owned For
Owner Type
Purchase Details
Closed on
Mar 9, 2023
Sold by
Dejong Glenda and Dejong Larry
Bought by
Krommendyk Riley
Current Estimated Value
Home Financials for this Owner
Home Financials are based on the most recent Mortgage that was taken out on this home.
Original Mortgage
$265,500
Outstanding Balance
$253,256
Interest Rate
6.32%
Mortgage Type
New Conventional
Estimated Equity
$142,637
Purchase Details
Closed on
Sep 25, 2012
Sold by
Bu Hull Industrial Development Corp
Bought by
Dejong Glenn L and Dejong Glenda
Create a Home Valuation Report for This Property
The Home Valuation Report is an in-depth analysis detailing your home's value as well as a comparison with similar homes in the area
Home Values in the Area
Average Home Value in this Area
Purchase History
| Date | Buyer | Sale Price | Title Company |
|---|---|---|---|
| Krommendyk Riley | $295,000 | -- | |
| Dejong Glenn L | $22,500 | None Available |
Source: Public Records
Mortgage History
| Date | Status | Borrower | Loan Amount |
|---|---|---|---|
| Open | Krommendyk Riley | $265,500 |
Source: Public Records
Tax History Compared to Growth
Tax History
| Year | Tax Paid | Tax Assessment Tax Assessment Total Assessment is a certain percentage of the fair market value that is determined by local assessors to be the total taxable value of land and additions on the property. | Land | Improvement |
|---|---|---|---|---|
| 2025 | $5,382 | $433,600 | $40,000 | $393,600 |
| 2024 | $5,382 | $364,760 | $40,000 | $324,760 |
| 2023 | $5,302 | $364,760 | $40,000 | $324,760 |
| 2022 | $5,292 | $316,170 | $40,000 | $276,170 |
| 2021 | $5,036 | $315,360 | $40,000 | $275,360 |
| 2020 | $5,036 | $285,850 | $40,000 | $245,850 |
| 2019 | $4,780 | $268,350 | $22,500 | $245,850 |
| 2018 | $4,876 | $268,350 | $22,500 | $245,850 |
| 2017 | $4,876 | $268,350 | $22,500 | $245,850 |
| 2014 | $3,984 | $112,890 | $0 | $0 |
Source: Public Records
Map
Nearby Homes