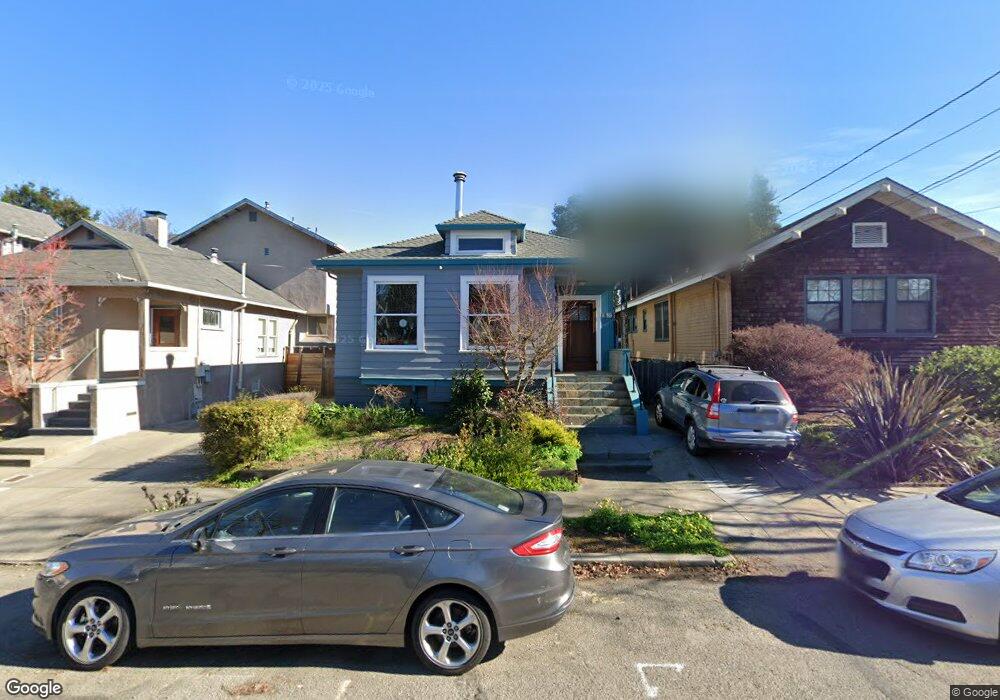
1530 Paru St Alameda, CA 94501
West Alameda NeighborhoodEstimated Value: $960,000 - $1,199,000
3
Beds
1
Bath
1,344
Sq Ft
$786/Sq Ft
Est. Value
About This Home
This home is located at 1530 Paru St, Alameda, CA 94501 and is currently estimated at $1,056,216, approximately $785 per square foot. 1530 Paru St is a home located in Alameda County with nearby schools including Maya Lin School, Will C. Wood Middle School, and Encinal Junior/Senior High.
Ownership History
Date
Name
Owned For
Owner Type
Purchase Details
Closed on
Aug 28, 2020
Sold by
Jacobsen Edwin R and Jacobsen Bonnie C
Bought by
Jacobsen Edwin Richard and Jacobsen Bonnie Cameron
Current Estimated Value
Home Financials for this Owner
Home Financials are based on the most recent Mortgage that was taken out on this home.
Original Mortgage
$339,500
Interest Rate
2.9%
Mortgage Type
New Conventional
Purchase Details
Closed on
Nov 16, 2012
Sold by
Jacobsen Edwin R and Jacobsen Bonnie Cameron
Bought by
Jacobsen Edwin Richard and Jacobsen Bonnie Cameron
Purchase Details
Closed on
Mar 12, 2009
Sold by
Jacobsen Edwin R and Jacobsen Bonnie Cameron
Bought by
Jacobsen Edwin R and Jacobsen Bonnie Cameron
Home Financials for this Owner
Home Financials are based on the most recent Mortgage that was taken out on this home.
Original Mortgage
$417,000
Interest Rate
5.19%
Mortgage Type
New Conventional
Create a Home Valuation Report for This Property
The Home Valuation Report is an in-depth analysis detailing your home's value as well as a comparison with similar homes in the area
Home Values in the Area
Average Home Value in this Area
Purchase History
| Date | Buyer | Sale Price | Title Company |
|---|---|---|---|
| Jacobsen Edwin Richard | -- | First American Title Ins Co | |
| Jacobsen Edwin R | -- | First American Title Ins Co | |
| Jacobsen Edwin Richard | -- | None Available | |
| Jacobsen Edwin R | -- | Fidelity National Title Co |
Source: Public Records
Mortgage History
| Date | Status | Borrower | Loan Amount |
|---|---|---|---|
| Closed | Jacobsen Edwin R | $339,500 | |
| Closed | Jacobsen Edwin R | $417,000 |
Source: Public Records
Tax History Compared to Growth
Tax History
| Year | Tax Paid | Tax Assessment Tax Assessment Total Assessment is a certain percentage of the fair market value that is determined by local assessors to be the total taxable value of land and additions on the property. | Land | Improvement |
|---|---|---|---|---|
| 2025 | $6,433 | $443,730 | $135,219 | $315,511 |
| 2024 | $6,433 | $434,893 | $132,568 | $309,325 |
| 2023 | $6,961 | $433,230 | $129,969 | $303,261 |
| 2022 | $6,811 | $417,736 | $127,421 | $297,315 |
| 2021 | $6,653 | $409,408 | $124,922 | $291,486 |
| 2020 | $6,574 | $412,141 | $123,642 | $288,499 |
| 2019 | $6,142 | $404,060 | $121,218 | $282,842 |
| 2018 | $5,993 | $396,140 | $118,842 | $277,298 |
| 2017 | $5,737 | $388,373 | $116,512 | $271,861 |
| 2016 | $5,732 | $380,758 | $114,227 | $266,531 |
| 2015 | $5,709 | $375,040 | $112,512 | $262,528 |
| 2014 | $5,468 | $367,695 | $110,308 | $257,387 |
Source: Public Records
Map
Nearby Homes
- 1572 Lincoln Ave
- 1707 Lincoln Ave
- 1428 Paru St
- 1701 Central Ave Unit P
- 1613 Union St
- 1613 Stanton St
- 1523 Lincoln Ave
- 1711 Arbor St
- 1661 Ave
- 1665 Ellen Craig Ave
- 1662 Larkspur St
- 1670 Larkspur St
- 1933 Grand St
- 1937 Grand St
- 1660 Clement Ave
- 610 Grand St
- 1815 Balsa St
- Residence 4 Plan at Skyline
- Residence 1 Plan at Skyline
- Residence 3 Plan at Skyline