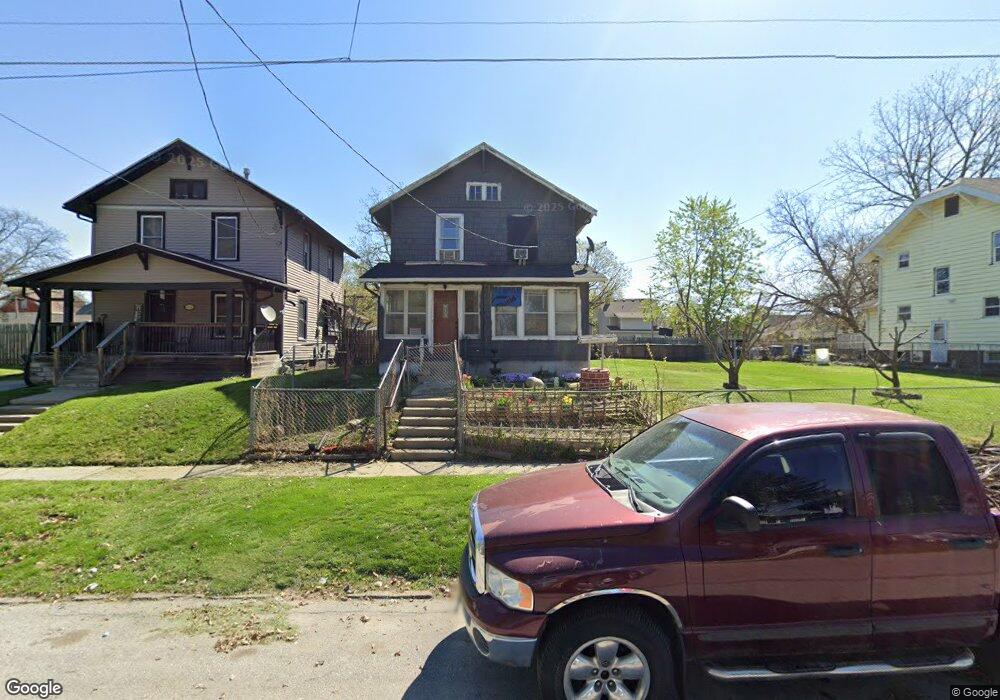
1531 23rd St Des Moines, IA 50311
Drake NeighborhoodEstimated Value: $154,436 - $166,000
2
Beds
1
Bath
1,182
Sq Ft
$134/Sq Ft
Est. Value
About This Home
This home is located at 1531 23rd St, Des Moines, IA 50311 and is currently estimated at $158,859, approximately $134 per square foot. 1531 23rd St is a home located in Polk County with nearby schools including Perkins Elementary School, Meredith Middle School, and Hoover High School.
Ownership History
Date
Name
Owned For
Owner Type
Purchase Details
Closed on
Jul 30, 2024
Sold by
Naig Real Estate Llc
Bought by
Lehs Kent
Current Estimated Value
Home Financials for this Owner
Home Financials are based on the most recent Mortgage that was taken out on this home.
Original Mortgage
$2,000,000
Outstanding Balance
$1,981,366
Interest Rate
6.47%
Mortgage Type
Credit Line Revolving
Estimated Equity
-$1,822,507
Purchase Details
Closed on
Jul 23, 2024
Sold by
Juneberry Street Trust and Schubert Geralyn Marie
Bought by
Velazquez Marjorie and Ortiz Luis
Home Financials for this Owner
Home Financials are based on the most recent Mortgage that was taken out on this home.
Original Mortgage
$2,000,000
Outstanding Balance
$1,981,366
Interest Rate
6.47%
Mortgage Type
Credit Line Revolving
Estimated Equity
-$1,822,507
Create a Home Valuation Report for This Property
The Home Valuation Report is an in-depth analysis detailing your home's value as well as a comparison with similar homes in the area
Home Values in the Area
Average Home Value in this Area
Purchase History
| Date | Buyer | Sale Price | Title Company |
|---|---|---|---|
| Lehs Kent | $75,000 | None Listed On Document | |
| Naig Real Estate Llc | $65,000 | None Listed On Document | |
| Velazquez Marjorie | $50,000 | None Listed On Document |
Source: Public Records
Mortgage History
| Date | Status | Borrower | Loan Amount |
|---|---|---|---|
| Open | Lehs Kent E | $2,000,000 | |
| Previous Owner | Clemenson Donnell M | $40,000 | |
| Previous Owner | Tiano Vincenzo G | $54,300 | |
| Previous Owner | Tiano Vincenzo | $48,000 |
Source: Public Records
Tax History Compared to Growth
Tax History
| Year | Tax Paid | Tax Assessment Tax Assessment Total Assessment is a certain percentage of the fair market value that is determined by local assessors to be the total taxable value of land and additions on the property. | Land | Improvement |
|---|---|---|---|---|
| 2025 | $2,076 | $75,100 | $11,900 | $63,200 |
| 2024 | $2,076 | $116,000 | $10,700 | $105,300 |
| 2023 | $1,888 | $116,000 | $10,700 | $105,300 |
| 2022 | $2,032 | $89,000 | $8,500 | $80,500 |
| 2021 | $1,776 | $89,000 | $8,500 | $80,500 |
| 2020 | $1,840 | $79,800 | $7,700 | $72,100 |
| 2019 | $1,806 | $79,800 | $7,700 | $72,100 |
| 2018 | $1,782 | $75,700 | $7,200 | $68,500 |
| 2017 | $1,682 | $75,700 | $7,200 | $68,500 |
| 2016 | $1,864 | $70,700 | $6,800 | $63,900 |
| 2015 | $1,864 | $70,700 | $6,800 | $63,900 |
| 2014 | $1,738 | $65,400 | $6,300 | $59,100 |
Source: Public Records
Map
Nearby Homes
- 1559 23rd St
- 1605 22nd St
- 1434 Martin Luther King Junior Pkwy
- 2103 Washington Ave
- 1557 27th St
- 1622 Martin Luther King Junior Pkwy
- 1429 Martin Luther King jr Pkwy
- 1318 23rd St
- 1656 Martin Luther King Junior Pkwy
- 1818 23rd St
- 2303 Carpenter Ave
- 1303 22nd St
- 1534 18th St
- 2736 Mondamin Ave
- 1946 Franklin Ave
- 1915 22nd St
- 1716 Mondamin Ave
- 1600 28th St
- 2014 23rd St
- 00 24th St