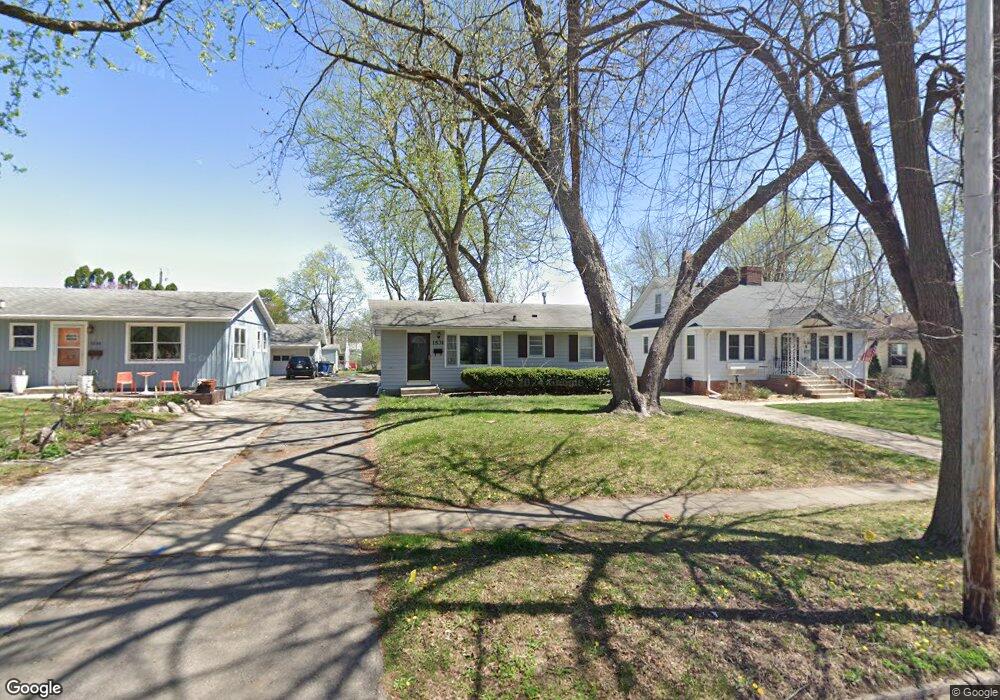
1531 44th St Des Moines, IA 50311
Beaverdale NeighborhoodEstimated Value: $224,000 - $255,000
3
Beds
2
Baths
856
Sq Ft
$277/Sq Ft
Est. Value
About This Home
This home is located at 1531 44th St, Des Moines, IA 50311 and is currently estimated at $237,531, approximately $277 per square foot. 1531 44th St is a home located in Polk County with nearby schools including Perkins Elementary School, Merrill Middle School, and Roosevelt High School.
Ownership History
Date
Name
Owned For
Owner Type
Purchase Details
Closed on
Sep 6, 2007
Sold by
Clark Jack A and Clark Barbara
Bought by
Discover Properties Llc
Current Estimated Value
Purchase Details
Closed on
Jun 12, 2006
Sold by
Discover Properties Llc
Bought by
Clark Jack A
Purchase Details
Closed on
Mar 3, 2005
Sold by
Swan William Randall
Bought by
Discovery Properties Llc
Home Financials for this Owner
Home Financials are based on the most recent Mortgage that was taken out on this home.
Original Mortgage
$101,700
Interest Rate
5.7%
Mortgage Type
Purchase Money Mortgage
Create a Home Valuation Report for This Property
The Home Valuation Report is an in-depth analysis detailing your home's value as well as a comparison with similar homes in the area
Home Values in the Area
Average Home Value in this Area
Purchase History
| Date | Buyer | Sale Price | Title Company |
|---|---|---|---|
| Discover Properties Llc | -- | None Available | |
| Clark Jack A | -- | None Available | |
| Discovery Properties Llc | $117,500 | -- |
Source: Public Records
Mortgage History
| Date | Status | Borrower | Loan Amount |
|---|---|---|---|
| Previous Owner | Discovery Properties Llc | $101,700 |
Source: Public Records
Tax History Compared to Growth
Tax History
| Year | Tax Paid | Tax Assessment Tax Assessment Total Assessment is a certain percentage of the fair market value that is determined by local assessors to be the total taxable value of land and additions on the property. | Land | Improvement |
|---|---|---|---|---|
| 2025 | $4,218 | $239,100 | $52,700 | $186,400 |
| 2024 | $4,218 | $214,400 | $46,700 | $167,700 |
| 2023 | $4,318 | $214,400 | $46,700 | $167,700 |
| 2022 | $4,284 | $183,200 | $41,200 | $142,000 |
| 2021 | $4,190 | $183,200 | $41,200 | $142,000 |
| 2020 | $4,352 | $167,900 | $37,600 | $130,300 |
| 2019 | $4,026 | $167,900 | $37,600 | $130,300 |
| 2018 | $3,986 | $149,800 | $32,900 | $116,900 |
| 2017 | $3,678 | $149,800 | $32,900 | $116,900 |
| 2016 | $3,584 | $136,000 | $29,500 | $106,500 |
| 2015 | $3,584 | $136,000 | $29,500 | $106,500 |
| 2014 | $3,316 | $124,800 | $26,700 | $98,100 |
Source: Public Records
Map
Nearby Homes