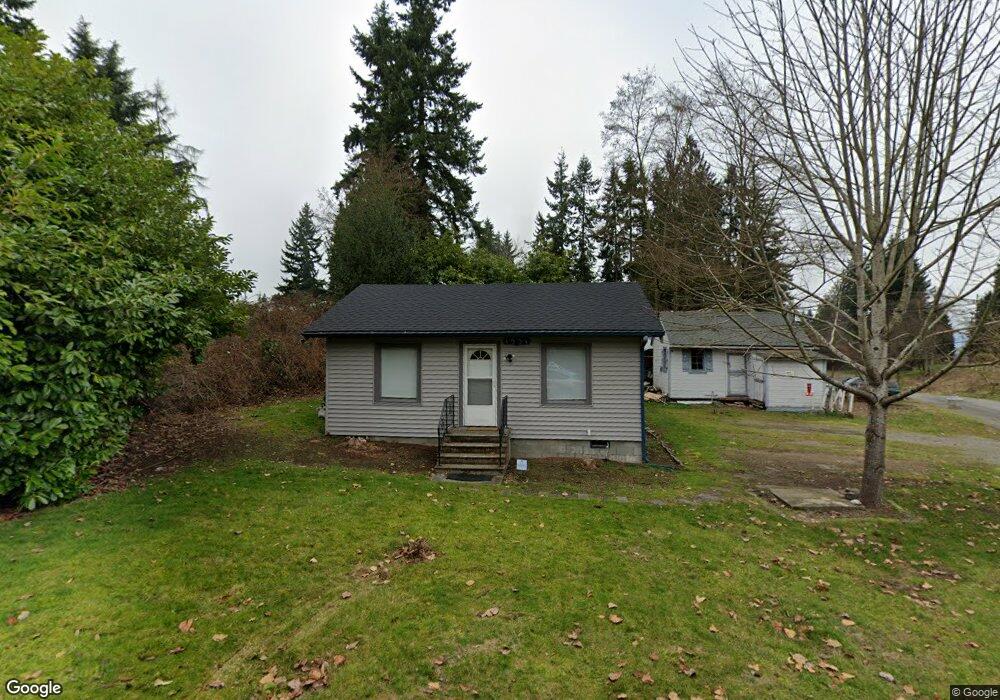
1531 74th St SE Everett, WA 98203
Pinehurst NeighborhoodEstimated Value: $447,000 - $484,000
2
Beds
1
Bath
1,008
Sq Ft
$461/Sq Ft
Est. Value
About This Home
This home is located at 1531 74th St SE, Everett, WA 98203 and is currently estimated at $465,146, approximately $461 per square foot. 1531 74th St SE is a home located in Snohomish County with nearby schools including Emerson Elementary School, Evergreen Middle School, and Cascade High School.
Ownership History
Date
Name
Owned For
Owner Type
Purchase Details
Closed on
Oct 1, 1998
Sold by
Norman Kelly D
Bought by
Kuljis Matthew G
Current Estimated Value
Home Financials for this Owner
Home Financials are based on the most recent Mortgage that was taken out on this home.
Original Mortgage
$134,700
Outstanding Balance
$29,440
Interest Rate
6.88%
Mortgage Type
FHA
Estimated Equity
$435,706
Purchase Details
Closed on
May 26, 1998
Sold by
Associates Financial Svcs Of America Inc
Bought by
Norman Kelly D
Home Financials for this Owner
Home Financials are based on the most recent Mortgage that was taken out on this home.
Original Mortgage
$92,621
Interest Rate
7.13%
Mortgage Type
Seller Take Back
Purchase Details
Closed on
Mar 16, 1998
Sold by
Greenlund Annie E
Bought by
Associates Financial Svcs Of America Inc
Home Financials for this Owner
Home Financials are based on the most recent Mortgage that was taken out on this home.
Original Mortgage
$92,852
Interest Rate
7.02%
Create a Home Valuation Report for This Property
The Home Valuation Report is an in-depth analysis detailing your home's value as well as a comparison with similar homes in the area
Home Values in the Area
Average Home Value in this Area
Purchase History
| Date | Buyer | Sale Price | Title Company |
|---|---|---|---|
| Kuljis Matthew G | $129,990 | -- | |
| Norman Kelly D | $92,621 | Chicago Title Insurance Co | |
| Associates Financial Svcs Of America Inc | $105,510 | First American |
Source: Public Records
Mortgage History
| Date | Status | Borrower | Loan Amount |
|---|---|---|---|
| Open | Kuljis Matthew G | $134,700 | |
| Previous Owner | Norman Kelly D | $92,621 | |
| Previous Owner | Associates Financial Svcs Of America Inc | $92,852 |
Source: Public Records
Tax History
| Year | Tax Paid | Tax Assessment Tax Assessment Total Assessment is a certain percentage of the fair market value that is determined by local assessors to be the total taxable value of land and additions on the property. | Land | Improvement |
|---|---|---|---|---|
| 2025 | $3,144 | $368,900 | $319,000 | $49,900 |
| 2024 | $3,144 | $364,900 | $315,000 | $49,900 |
| 2023 | $3,452 | $419,100 | $315,000 | $104,100 |
| 2022 | $3,003 | $327,100 | $238,000 | $89,100 |
| 2020 | $2,885 | $256,300 | $177,000 | $79,300 |
| 2019 | $2,660 | $237,900 | $160,000 | $77,900 |
| 2018 | $2,575 | $211,100 | $141,000 | $70,100 |
| 2017 | $2,308 | $188,500 | $126,000 | $62,500 |
| 2016 | $1,845 | $158,300 | $98,000 | $60,300 |
Source: Public Records
Map
Nearby Homes
- 7515 Cascade Dr
- 1910 75th St SE Unit 2E
- 1926 Monroe Ave
- 1716 Scenic Dr
- 7027 Rainier Dr Unit E
- 7027 Rainier Dr Unit G
- 7027 Rainier Dr Unit H
- 7027 Rainier Dr Unit A
- 7807 Grant Dr
- 7822 Beverly Blvd Unit A
- 6627 Beverly Blvd Unit A
- 2011 Madison St
- 7921 20th Ave SE
- 6611 Commercial Ave Unit 3
- 8031 Florida Dr
- 820 Cady Rd Unit H304
- 820 Cady Rd Unit B305
- 820 Cady Rd Unit F103
- 747 75th St SE Unit B203
- 6606 Lombard Ave Unit 3
Your Personal Tour Guide
Ask me questions while you tour the home.