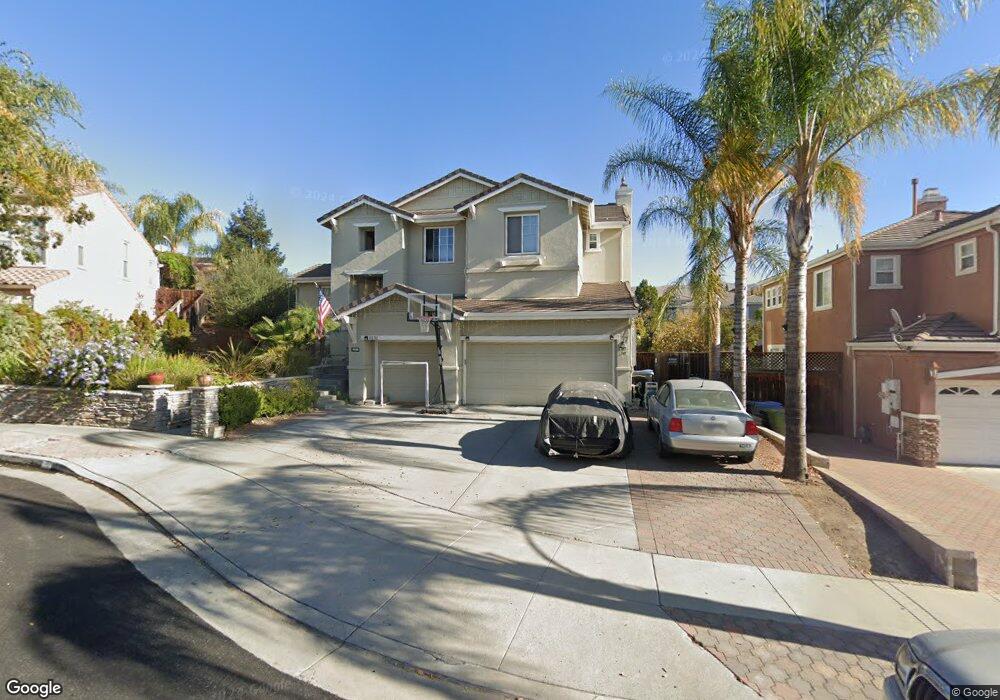
1531 Schramm Way San Jose, CA 95127
East Foothills NeighborhoodEstimated Value: $2,057,000 - $2,120,000
4
Beds
3
Baths
2,773
Sq Ft
$754/Sq Ft
Est. Value
About This Home
This home is located at 1531 Schramm Way, San Jose, CA 95127 and is currently estimated at $2,090,232, approximately $753 per square foot. 1531 Schramm Way is a home located in Santa Clara County with nearby schools including Mt. Pleasant High School, Adelante Dual Language Academy, and Aptitud Community Academy At Goss.
Ownership History
Date
Name
Owned For
Owner Type
Purchase Details
Closed on
Oct 29, 2004
Sold by
Wong Edward Wai Hong and Wong Yi
Bought by
Behashti Mustafa and Behashti Clara
Current Estimated Value
Home Financials for this Owner
Home Financials are based on the most recent Mortgage that was taken out on this home.
Original Mortgage
$708,750
Outstanding Balance
$332,068
Interest Rate
4.87%
Mortgage Type
Purchase Money Mortgage
Estimated Equity
$1,758,164
Purchase Details
Closed on
Feb 11, 1999
Sold by
Greystone Homes Inc
Bought by
Wong Edward Wai Hong and Wong Yi
Home Financials for this Owner
Home Financials are based on the most recent Mortgage that was taken out on this home.
Original Mortgage
$390,000
Interest Rate
6.78%
Create a Home Valuation Report for This Property
The Home Valuation Report is an in-depth analysis detailing your home's value as well as a comparison with similar homes in the area
Home Values in the Area
Average Home Value in this Area
Purchase History
| Date | Buyer | Sale Price | Title Company |
|---|---|---|---|
| Behashti Mustafa | $945,000 | North American Title Company | |
| Wong Edward Wai Hong | $495,000 | Old Republic Title Company |
Source: Public Records
Mortgage History
| Date | Status | Borrower | Loan Amount |
|---|---|---|---|
| Open | Behashti Mustafa | $708,750 | |
| Previous Owner | Wong Edward Wai Hong | $390,000 | |
| Closed | Behashti Mustafa | $86,300 |
Source: Public Records
Tax History Compared to Growth
Tax History
| Year | Tax Paid | Tax Assessment Tax Assessment Total Assessment is a certain percentage of the fair market value that is determined by local assessors to be the total taxable value of land and additions on the property. | Land | Improvement |
|---|---|---|---|---|
| 2025 | $18,794 | $1,394,585 | $790,059 | $604,526 |
| 2024 | $18,794 | $1,367,241 | $774,568 | $592,673 |
| 2023 | $18,138 | $1,340,433 | $759,381 | $581,052 |
| 2022 | $18,004 | $1,314,151 | $744,492 | $569,659 |
| 2021 | $18,194 | $1,288,385 | $729,895 | $558,490 |
| 2020 | $17,496 | $1,275,175 | $722,411 | $552,764 |
| 2019 | $17,092 | $1,250,173 | $708,247 | $541,926 |
| 2018 | $16,629 | $1,225,660 | $694,360 | $531,300 |
| 2017 | $16,419 | $1,201,629 | $680,746 | $520,883 |
| 2016 | $15,666 | $1,157,300 | $655,000 | $502,300 |
| 2015 | $14,698 | $1,061,800 | $601,500 | $460,300 |
| 2014 | $12,303 | $907,500 | $514,100 | $393,400 |
Source: Public Records
Map
Nearby Homes
- 3514 Ramstad Dr
- 3472 Kaylene Dr
- 3457 Ramstad Dr
- 10150 Clayton Rd
- 1310 Park Pleasant Cir
- 3382 Mount Wilson Dr
- 3341 Hickerson Dr
- 14862 Watters Dr
- 1245 Fleming Ave
- 14440 Victoria Ct
- 3434 Dominick Ct
- 3253 Arthur Ave
- 3549 Columbine Dr
- 1122 Lancelot Ln
- 801 Fleming Ave
- 10230 Griffith St
- 681 Heirloom Ct
- 950 Macduff Ct
- 14545 Jerilyn Dr
- 10281 Murtha Dr
- 1525 Schramm Way
- 1537 Schramm Way
- 3507 Rafter Ridge Dr
- 3498 Kaylene Dr
- 3506 Lee Terrace Ct Unit 2
- 3506 Lee Terrace Ct Unit A
- 3506 Lee Terrace Ct
- 1538 Schramm Way
- 3492 Kaylene Dr
- 3513 Rafter Ridge Dr
- 3500 Lee Terrace Ct
- 1532 Schramm Way
- 1526 Schramm Way
- 1513 Schramm Way
- 1520 Schramm Way
- 3508 Rafter Ridge Dr
- 3512 Lee Terrace Ct
- 3486 Kaylene Dr
- 1522 Calco Creek Dr
- 1270 Ridgeline Ct