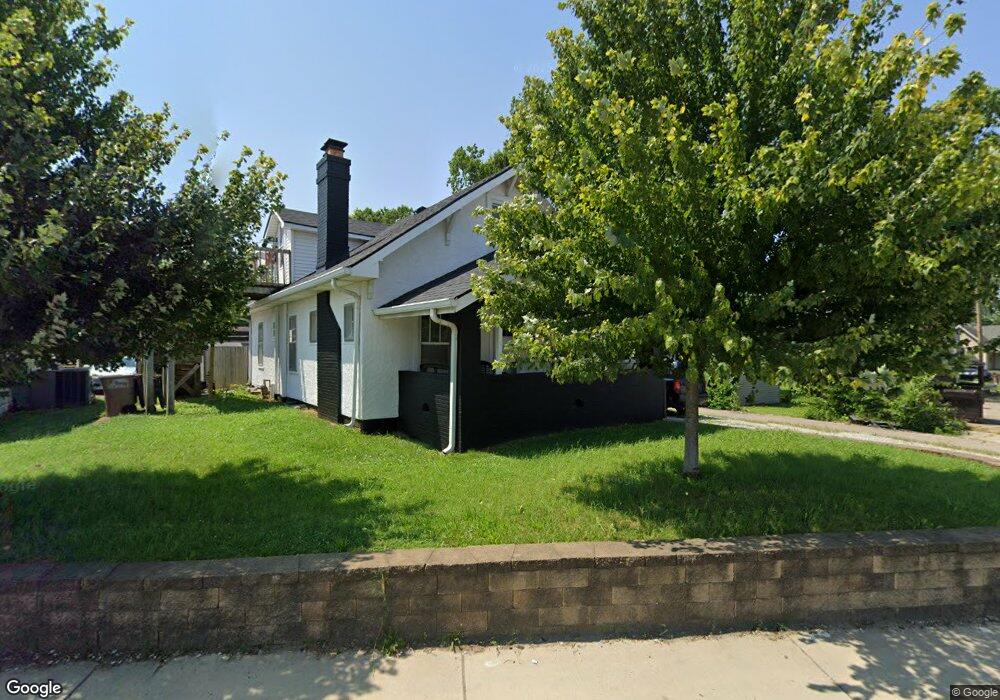
1531 State St Columbus, IN 47201
Estimated Value: $179,000 - $213,582
About This Home
1531 1/2 State St. Columbus, Indiana
******Completely Renovated******
((((((( Upstairs )))))))) furnished efficiency/
Studio Apartment for Rent $750.00monthly
Deposit $750.00
Has it own outside staircase entrance & parking
Tenant pays Electric & water.
1- year lease
Walkable distance to Cummins Plant 1
3 minutes to downtown Columbus, Indiana
*****NO PETS ******
*****No SMOKING ****
Custom Cabinets
2-burner stove top
2-drawer refrigerator
Microwave
Subway Tiled shower
Adorable porcelain bathroom sink
New toilet
All new countertops
All new faucets kitchen, bathroom sink & shower
2-New Windows
New baseboard heat
Window ac
Overhead lighting
All new flooring
This is a home with one tenant on ground
Ownership History
Purchase Details
Home Values in the Area
Average Home Value in this Area
Purchase History
| Date | Buyer | Sale Price | Title Company |
|---|---|---|---|
| City Of Columbus | -- | None Available |
Property History
| Date | Event | Price | List to Sale | Price per Sq Ft |
|---|---|---|---|---|
| 10/08/2024 10/08/24 | Off Market | $800 | -- | -- |
| 10/01/2024 10/01/24 | For Rent | $800 | -- | -- |
Tax History
| Year | Tax Paid | Tax Assessment Tax Assessment Total Assessment is a certain percentage of the fair market value that is determined by local assessors to be the total taxable value of land and additions on the property. | Land | Improvement |
|---|---|---|---|---|
| 2025 | $3,718 | $156,200 | $48,100 | $108,100 |
| 2024 | $3,528 | $150,200 | $48,100 | $102,100 |
| 2023 | $3,528 | $144,300 | $48,100 | $96,200 |
| 2022 | $3,339 | $137,000 | $48,100 | $88,900 |
| 2021 | $3,324 | $134,100 | $48,100 | $86,000 |
| 2020 | $3,422 | $136,400 | $48,100 | $88,300 |
| 2019 | $3,067 | $131,100 | $48,100 | $83,000 |
| 2018 | $3,322 | $131,000 | $48,100 | $82,900 |
| 2017 | $2,229 | $124,900 | $35,100 | $89,800 |
| 2016 | $2,916 | $124,900 | $35,100 | $89,800 |
| 2014 | $2,801 | $120,500 | $35,200 | $85,300 |
Map
- 52 N Hinman St
- 1932 Indiana Ave
- 2061 Ohio Ave
- 62 S Mapleton St
- 303 Hope Ave
- 2263 Wallace Ave
- 2262 Mckinley Ave
- 2291 Mcclure St
- 2331 Indiana Ave
- 822 7th St
- 844 Cottage Ave
- 806 7th St
- 2115 Irwin Dr
- 2035 10th St
- 450 South
- 818 Sycamore St
- 42 S Ross St
- 738 Lafayette Ave
- 924 & 926 Pearl St
- 1132 Chestnut St
Ask me questions while you tour the home.