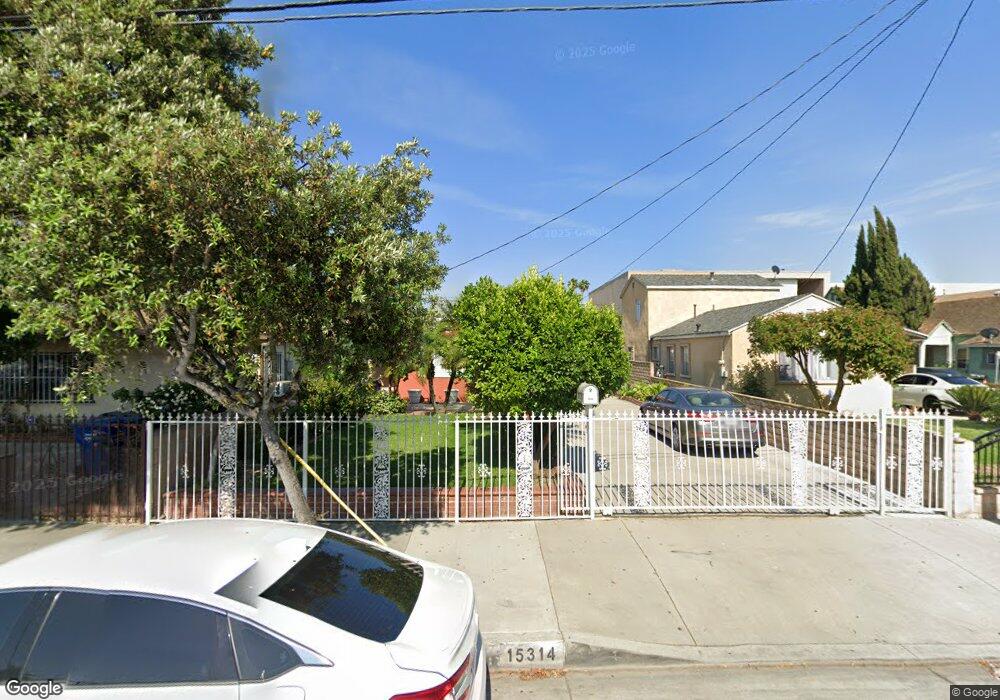
15314 San Jose Ave Paramount, CA 90723
Estimated Value: $645,330 - $710,000
3
Beds
2
Baths
1,165
Sq Ft
$588/Sq Ft
Est. Value
About This Home
This home is located at 15314 San Jose Ave, Paramount, CA 90723 and is currently estimated at $685,583, approximately $588 per square foot. 15314 San Jose Ave is a home located in Los Angeles County with nearby schools including Mark Keppel School, Frank J. Zamboni School, and Paramount High School.
Ownership History
Date
Name
Owned For
Owner Type
Purchase Details
Closed on
Sep 5, 2025
Sold by
Perez Alba Daniel and Perez Daniel Luis
Bought by
Alba Daniel Perez and Perez Luis Daniel
Current Estimated Value
Home Financials for this Owner
Home Financials are based on the most recent Mortgage that was taken out on this home.
Original Mortgage
$425,000
Outstanding Balance
$425,000
Interest Rate
6.72%
Mortgage Type
New Conventional
Estimated Equity
$260,583
Purchase Details
Closed on
Apr 18, 1997
Sold by
Torok Attila and Torok Kay
Bought by
Alba Daniel Perez
Home Financials for this Owner
Home Financials are based on the most recent Mortgage that was taken out on this home.
Original Mortgage
$152,028
Interest Rate
8.13%
Mortgage Type
FHA
Purchase Details
Closed on
Nov 13, 1996
Sold by
Ford Consumer Finance Company Inc
Bought by
Torok Attila
Home Financials for this Owner
Home Financials are based on the most recent Mortgage that was taken out on this home.
Original Mortgage
$68,000
Interest Rate
7.91%
Purchase Details
Closed on
Aug 30, 1996
Sold by
Alvarado Rafael and Alvarado Delia C
Bought by
Ford Consumer Finance Company Inc
Create a Home Valuation Report for This Property
The Home Valuation Report is an in-depth analysis detailing your home's value as well as a comparison with similar homes in the area
Home Values in the Area
Average Home Value in this Area
Purchase History
| Date | Buyer | Sale Price | Title Company |
|---|---|---|---|
| Alba Daniel Perez | -- | Ticor Title | |
| Alba Daniel Perez | -- | Ticor Title | |
| Alba Daniel Perez | $155,000 | Fidelity National Title Ins | |
| Torok Attila | $85,000 | American Title Ins Company | |
| Ford Consumer Finance Company Inc | $119,000 | Stewart Title |
Source: Public Records
Mortgage History
| Date | Status | Borrower | Loan Amount |
|---|---|---|---|
| Open | Alba Daniel Perez | $425,000 | |
| Previous Owner | Alba Daniel Perez | $152,028 | |
| Previous Owner | Torok Attila | $68,000 |
Source: Public Records
Tax History
| Year | Tax Paid | Tax Assessment Tax Assessment Total Assessment is a certain percentage of the fair market value that is determined by local assessors to be the total taxable value of land and additions on the property. | Land | Improvement |
|---|---|---|---|---|
| 2025 | $3,493 | $252,422 | $113,995 | $138,427 |
| 2024 | $3,493 | $247,473 | $111,760 | $135,713 |
| 2023 | $3,430 | $242,621 | $109,569 | $133,052 |
| 2022 | $3,339 | $237,865 | $107,421 | $130,444 |
| 2021 | $3,261 | $233,202 | $105,315 | $127,887 |
| 2019 | $3,331 | $226,288 | $102,193 | $124,095 |
| 2018 | $3,052 | $221,852 | $100,190 | $121,662 |
| 2016 | $2,741 | $213,239 | $96,300 | $116,939 |
| 2015 | $2,590 | $210,037 | $94,854 | $115,183 |
| 2014 | $2,651 | $205,923 | $92,996 | $112,927 |
Source: Public Records
Map
Nearby Homes
- 15325 Orange Ave
- 15351 Orange Ave Unit 17
- 6542 San Luis St
- 7032 Somerset Blvd
- 15137 Gundry Ave Unit F
- 6556 San Vincente St
- 7047 San Marcus St
- 6733 Caro St Unit 47
- 6882 Alondra Blvd Unit 26
- 15211 S Gibson Ave
- 14944 Texaco Ave
- 6656 Rosecrans Ave Unit N-10
- 6824 Marcelle St
- 16313 Hunsaker Ave
- 4623 E Compton Blvd
- 4956 E San Carlos St
- 6313 Rancho Parada Rd
- 1050 E 72nd St
- 4949 E San Carlos St
- 15412 S Atlantic Ave
- 15310 San Jose Ave
- 15320 San Jose Ave
- 15308 San Jose Ave
- 15324 San Jose Ave
- 15328 San Jose Ave
- 15302 San Jose Ave
- 15332 San Jose Ave
- 15336 San Jose Ave
- 15164 San Jose Ave
- 15338 San Jose Ave
- 6615 Mark Keppel St
- 15344 San Jose Ave
- 15163 San Jose Ave
- 15348 San Jose Ave
- 15154 San Jose Ave
- 15157 San Jose Ave
- 15352 San Jose Ave
- 15150 San Jose Ave
- 15149 Faulkner Ave
- 15155 San Jose Ave
Your Personal Tour Guide
Ask me questions while you tour the home.