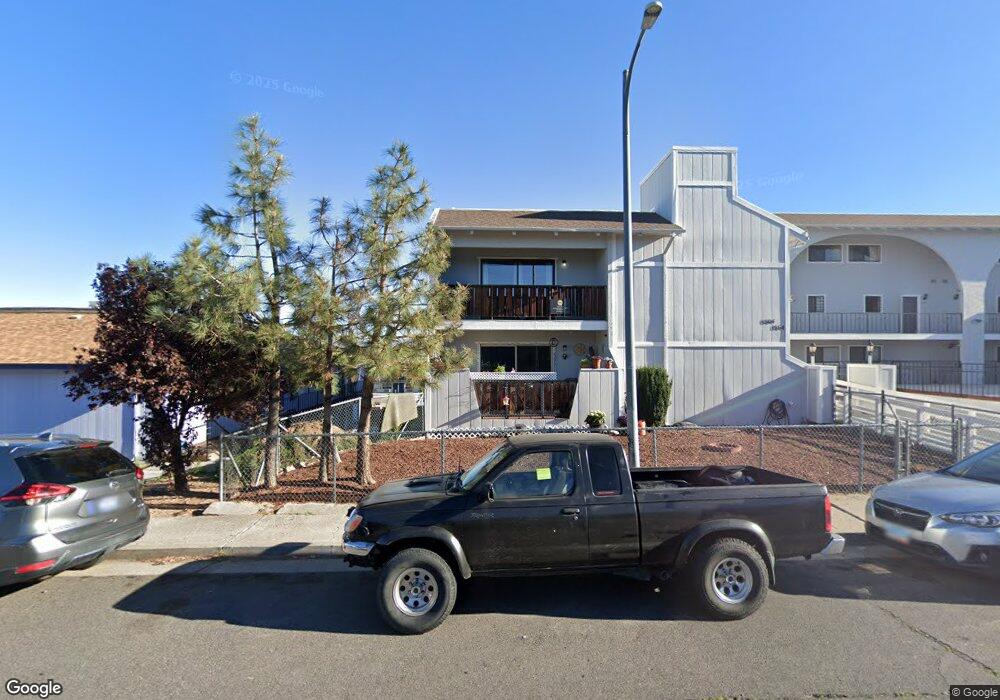
1532 Carlin St Unit 9 Reno, NV 89503
Kings Row NeighborhoodEstimated Value: $224,000 - $228,000
2
Beds
2
Baths
1,062
Sq Ft
$213/Sq Ft
Est. Value
About This Home
This home is located at 1532 Carlin St Unit 9, Reno, NV 89503 and is currently estimated at $225,923, approximately $212 per square foot. 1532 Carlin St Unit 9 is a home located in Washoe County with nearby schools including Elmcrest Elementary School, Archie Clayton Pre-AP Academy, and Reno High School.
Ownership History
Date
Name
Owned For
Owner Type
Purchase Details
Closed on
Jun 28, 2018
Sold by
Ingold Linda M
Bought by
Ingold Linda M and Ingold Truist
Current Estimated Value
Purchase Details
Closed on
May 28, 2008
Sold by
Ingold Linda M
Bought by
Ingold Linda M
Purchase Details
Closed on
Jan 22, 2003
Sold by
Miranda Sandra L
Bought by
Ingold Linda M
Home Financials for this Owner
Home Financials are based on the most recent Mortgage that was taken out on this home.
Original Mortgage
$30,000
Interest Rate
5.36%
Mortgage Type
Purchase Money Mortgage
Purchase Details
Closed on
Jan 17, 2003
Sold by
Ingold Stephen E
Bought by
Ingold Linda M
Home Financials for this Owner
Home Financials are based on the most recent Mortgage that was taken out on this home.
Original Mortgage
$30,000
Interest Rate
5.36%
Mortgage Type
Purchase Money Mortgage
Purchase Details
Closed on
Jun 3, 1999
Sold by
Miranda Bertha M and Miranda Sandra L
Bought by
Miranda Sandra L
Create a Home Valuation Report for This Property
The Home Valuation Report is an in-depth analysis detailing your home's value as well as a comparison with similar homes in the area
Home Values in the Area
Average Home Value in this Area
Purchase History
| Date | Buyer | Sale Price | Title Company |
|---|---|---|---|
| Ingold Linda M | -- | None Available | |
| Ingold Linda M | -- | First American Title Reno | |
| Ingold Linda M | $77,500 | First American Title | |
| Ingold Linda M | -- | First American Title | |
| Miranda Sandra L | -- | -- |
Source: Public Records
Mortgage History
| Date | Status | Borrower | Loan Amount |
|---|---|---|---|
| Closed | Ingold Linda M | $30,000 |
Source: Public Records
Tax History
| Year | Tax Paid | Tax Assessment Tax Assessment Total Assessment is a certain percentage of the fair market value that is determined by local assessors to be the total taxable value of land and additions on the property. | Land | Improvement |
|---|---|---|---|---|
| 2026 | -- | $35,249 | $20,230 | $15,019 |
| 2024 | $497 | $32,554 | $17,640 | $14,914 |
| 2023 | $497 | $29,831 | $16,870 | $12,961 |
| 2022 | $478 | $26,543 | $14,700 | $11,843 |
| 2021 | $469 | $23,573 | $11,270 | $12,303 |
| 2020 | $448 | $24,131 | $11,305 | $12,826 |
| 2019 | $435 | $24,674 | $11,760 | $12,914 |
| 2018 | $423 | $21,126 | $8,155 | $12,971 |
| 2017 | $416 | $19,281 | $6,090 | $13,191 |
| 2016 | $405 | $17,332 | $3,640 | $13,692 |
| 2015 | $404 | $17,106 | $2,800 | $14,306 |
| 2014 | $393 | $16,645 | $2,660 | $13,985 |
| 2013 | -- | $14,200 | $2,240 | $11,960 |
Source: Public Records
Map
Nearby Homes
- 1801 Carlin St
- 16 Raymond Dr
- 2071 W 4th St Unit 42
- 2091 W 4th St
- 1060 Whitaker Dr
- 1340 Jones St
- 1321 Jones St
- 2300 Dickerson Rd
- 2300 Dickerson Rd Unit 16
- 144 Keystone Ave
- 138 Keystone Ave
- 1695 Severn Dr
- 1620 Harold Dr
- 112 Keystone Ave Unit 1/2
- 2562 River Hatchling Ln
- 840 Brookfield Dr
- 176 Rissone Ln
- 1720 Grandview Ave
- 166 Rissone Ln
- 160 Rissone Ln
- 1536 Carlin St
- 1540 Carlin St
- 1540 Carlin St Unit Bld 1
- 1504 Carlin St Unit 1
- 1512 Carlin St Unit 4
- 1544 Carlin St
- 1548 Carlin St
- 1516 Carlin St Unit 4
- 1525 Stardust St
- 1552 Carlin St
- 1556 Carlin St Unit 15
- 1520 Carlin St
- 1564 Carlin St
- 1560 Carlin St
- 1525 Stardust St
- 1595 Stardust St
- 1501&1525 Stardust St
- 1425 Stardust St
- 1570 Carlin St
- 1501 Stardust St
Your Personal Tour Guide
Ask me questions while you tour the home.