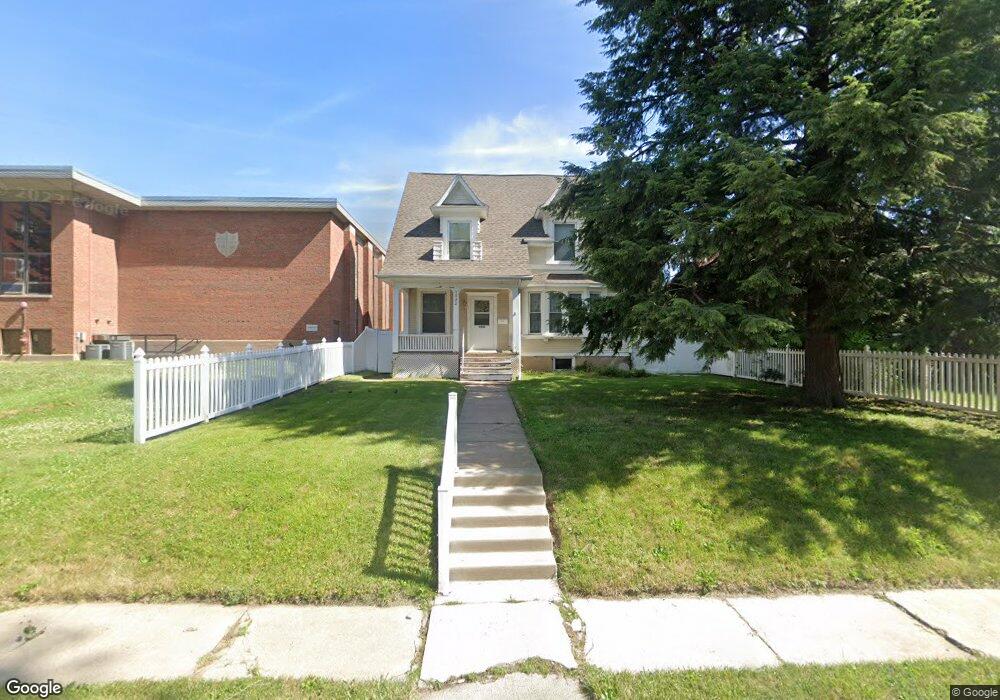
1532 Clay St Davenport, IA 52804
Riverview Terrace NeighborhoodEstimated Value: $131,000 - $164,000
4
Beds
2
Baths
1,489
Sq Ft
$100/Sq Ft
Est. Value
About This Home
This home is located at 1532 Clay St, Davenport, IA 52804 and is currently estimated at $148,505, approximately $99 per square foot. 1532 Clay St is a home located in Scott County with nearby schools including Walnut Hill Elementary School, South Christian Elementary School, and Christian County Middle School.
Ownership History
Date
Name
Owned For
Owner Type
Purchase Details
Closed on
Oct 10, 2011
Sold by
Schluenz Rex Robert
Bought by
Lodge Cynthia Lynne and Schluenz Cynthia Lynne
Current Estimated Value
Purchase Details
Closed on
Mar 28, 2005
Sold by
Great Prairie Land & Development
Bought by
Torres Ronald J and Torres Kay A
Home Financials for this Owner
Home Financials are based on the most recent Mortgage that was taken out on this home.
Original Mortgage
$89,900
Outstanding Balance
$45,667
Interest Rate
5.64%
Mortgage Type
New Conventional
Estimated Equity
$102,838
Purchase Details
Closed on
Mar 24, 2005
Sold by
Torres Ronard J and Torres Kay A
Bought by
Schluenz Rex R and Lodge Cynthia L
Home Financials for this Owner
Home Financials are based on the most recent Mortgage that was taken out on this home.
Original Mortgage
$89,900
Outstanding Balance
$45,667
Interest Rate
5.64%
Mortgage Type
New Conventional
Estimated Equity
$102,838
Create a Home Valuation Report for This Property
The Home Valuation Report is an in-depth analysis detailing your home's value as well as a comparison with similar homes in the area
Home Values in the Area
Average Home Value in this Area
Purchase History
| Date | Buyer | Sale Price | Title Company |
|---|---|---|---|
| Lodge Cynthia Lynne | -- | None Available | |
| Torres Ronald J | $87,000 | None Available | |
| Schluenz Rex R | $90,000 | None Available |
Source: Public Records
Mortgage History
| Date | Status | Borrower | Loan Amount |
|---|---|---|---|
| Open | Schluenz Rex R | $89,900 |
Source: Public Records
Tax History Compared to Growth
Tax History
| Year | Tax Paid | Tax Assessment Tax Assessment Total Assessment is a certain percentage of the fair market value that is determined by local assessors to be the total taxable value of land and additions on the property. | Land | Improvement |
|---|---|---|---|---|
| 2025 | $2,140 | $130,000 | $12,250 | $117,750 |
| 2024 | $2,084 | $130,000 | $12,250 | $117,750 |
| 2023 | $2,144 | $130,000 | $12,250 | $117,750 |
| 2022 | $2,152 | $109,210 | $12,250 | $96,960 |
| 2021 | $2,152 | $109,210 | $12,250 | $96,960 |
| 2020 | $2,064 | $103,830 | $12,250 | $91,580 |
| 2019 | $2,138 | $103,830 | $12,250 | $91,580 |
| 2018 | $1,970 | $103,830 | $12,250 | $91,580 |
| 2017 | $2,044 | $98,440 | $12,250 | $86,190 |
| 2016 | $1,964 | $98,440 | $0 | $0 |
| 2015 | $1,964 | $95,470 | $0 | $0 |
| 2014 | $1,926 | $95,470 | $0 | $0 |
| 2013 | $1,890 | $0 | $0 | $0 |
| 2012 | -- | $104,310 | $14,210 | $90,100 |
Source: Public Records
Map
Nearby Homes
- 1446 Clay St
- 1604 W 9th St
- 1505 W 14th St
- 1414 W 9th St
- 1701 W 8th St
- 1335 W 13th St
- 1309 Clay St
- 1321 W 13th St
- 4735 W 12th St
- 1419 N Division St
- 1824 W 8th St
- 1445 W 7th St
- 1207 N Marquette St
- 1854 W 8th St
- 1604 N Division St
- 817 N Marquette St
- 1514 N Marquette St
- 1119 W 8th St
- 1111 W 8th St
- 1118 W 15th St