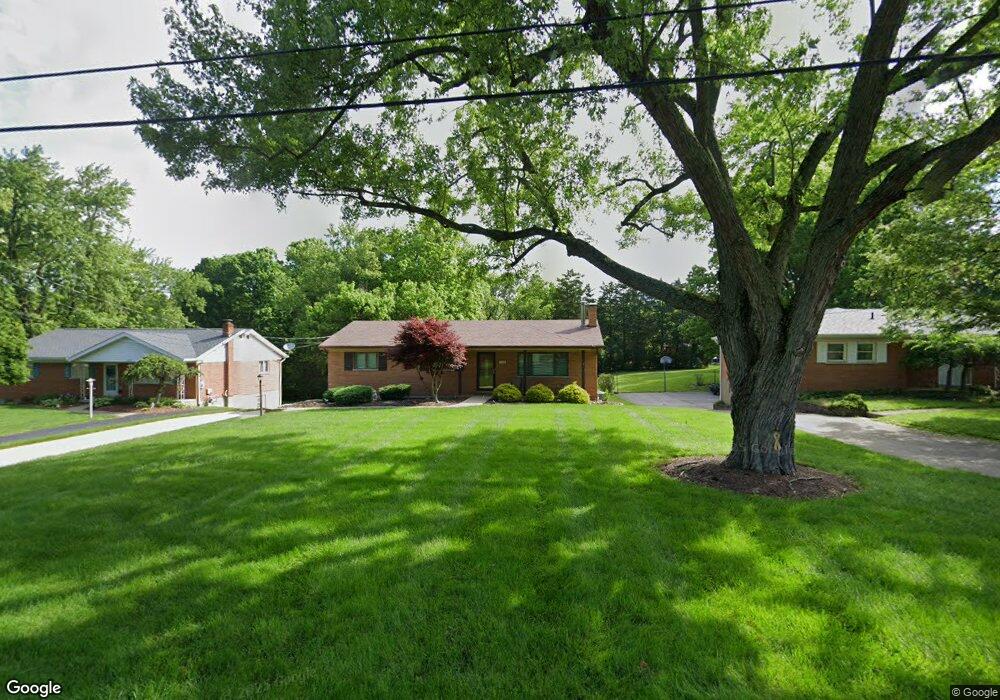
1532 Devils Backbone Rd Cincinnati, OH 45233
Estimated Value: $266,934 - $381,000
3
Beds
3
Baths
1,392
Sq Ft
$214/Sq Ft
Est. Value
About This Home
This home is located at 1532 Devils Backbone Rd, Cincinnati, OH 45233 and is currently estimated at $297,734, approximately $213 per square foot. 1532 Devils Backbone Rd is a home located in Hamilton County with nearby schools including John Foster Dulles Elementary School, Rapid Run Middle School, and Oak Hills High School.
Ownership History
Date
Name
Owned For
Owner Type
Purchase Details
Closed on
Nov 24, 2012
Sold by
Dollenmayer Scott J
Bought by
Dollenmayer Julie
Current Estimated Value
Purchase Details
Closed on
Jun 28, 2001
Sold by
Wysong James G and Wysong Helen M
Bought by
Dollenmayer Scott J and Dollenmayer Julie A
Home Financials for this Owner
Home Financials are based on the most recent Mortgage that was taken out on this home.
Original Mortgage
$159,626
Outstanding Balance
$58,646
Interest Rate
7.14%
Estimated Equity
$239,088
Purchase Details
Closed on
Aug 25, 2000
Sold by
Wysong James G and Wysong Helen M
Bought by
Damen Thomas R and Damen Keli
Create a Home Valuation Report for This Property
The Home Valuation Report is an in-depth analysis detailing your home's value as well as a comparison with similar homes in the area
Home Values in the Area
Average Home Value in this Area
Purchase History
| Date | Buyer | Sale Price | Title Company |
|---|---|---|---|
| Dollenmayer Julie | -- | Attorney | |
| Dollenmayer Scott J | $177,500 | -- | |
| Damen Thomas R | -- | -- |
Source: Public Records
Mortgage History
| Date | Status | Borrower | Loan Amount |
|---|---|---|---|
| Open | Dollenmayer Scott J | $159,626 |
Source: Public Records
Tax History
| Year | Tax Paid | Tax Assessment Tax Assessment Total Assessment is a certain percentage of the fair market value that is determined by local assessors to be the total taxable value of land and additions on the property. | Land | Improvement |
|---|---|---|---|---|
| 2025 | $3,818 | $72,954 | $16,506 | $56,448 |
| 2024 | $3,734 | $72,954 | $16,506 | $56,448 |
| 2023 | $3,730 | $72,954 | $16,506 | $56,448 |
| 2022 | $3,258 | $53,995 | $11,834 | $42,161 |
| 2021 | $2,935 | $53,995 | $11,834 | $42,161 |
| 2020 | $2,964 | $53,995 | $11,834 | $42,161 |
| 2019 | $2,904 | $48,210 | $10,567 | $37,643 |
| 2018 | $2,908 | $48,210 | $10,567 | $37,643 |
| 2017 | $2,746 | $48,210 | $10,567 | $37,643 |
| 2016 | $2,620 | $45,886 | $10,854 | $35,032 |
| 2015 | $2,639 | $45,886 | $10,854 | $35,032 |
| 2014 | $2,642 | $45,886 | $10,854 | $35,032 |
| 2013 | $2,495 | $46,347 | $10,962 | $35,385 |
Source: Public Records
Map
Nearby Homes
- 1659 Devils Backbone Rd
- 1711 Ebenezer Rd
- 5949 Cleves Warsaw Pike
- 6009 Cleves Warsaw Pike
- 1287 Heather Ridge
- 1259 Wexford Ln
- 5749 Beech Grove Ln
- 6090 Muddy Creek Rd
- 5671 Julmar Dr
- 6278 Gardenlake Ct
- 6040 Countrymeadow Ln
- 5690 Candlelite Terrace
- 1006 Pineknot Dr
- 837 Neeb Rd
- 5600 Antoninus Dr
- 5664 Rapid Run Rd
- 2239 Quail Run Farm Ln
- 5789 Juvene Way
- 2417 Quail Run Farm Ln
- 5524 Sidney Rd
- 1520 Devils Backbone Rd
- 1510 Devils Backbone Rd
- 1584 Devils Backbone Rd
- 1496 Devils Backbone Rd
- 1586 Devils Backbone Rd
- 5990 Beechtop Dr
- 1543 Devils Backbone Rd
- 1581 Devils Backbone Rd
- 5982 Beechtop Dr
- 1555 Devils Backbone Rd
- 1565 Devils Backbone Rd
- 1612 Devils Backbone Rd
- 1476 Devils Backbone Rd
- 1503 Devils Backbone Rd
- 1588 Devils Backbone Rd
- 5976 Beechtop Dr
- 1615 Devils Backbone Rd
- 1464 Devils Backbone Rd
- 1632 Devils Backbone Rd
- 1489 Devils Backbone Rd
Your Personal Tour Guide
Ask me questions while you tour the home.