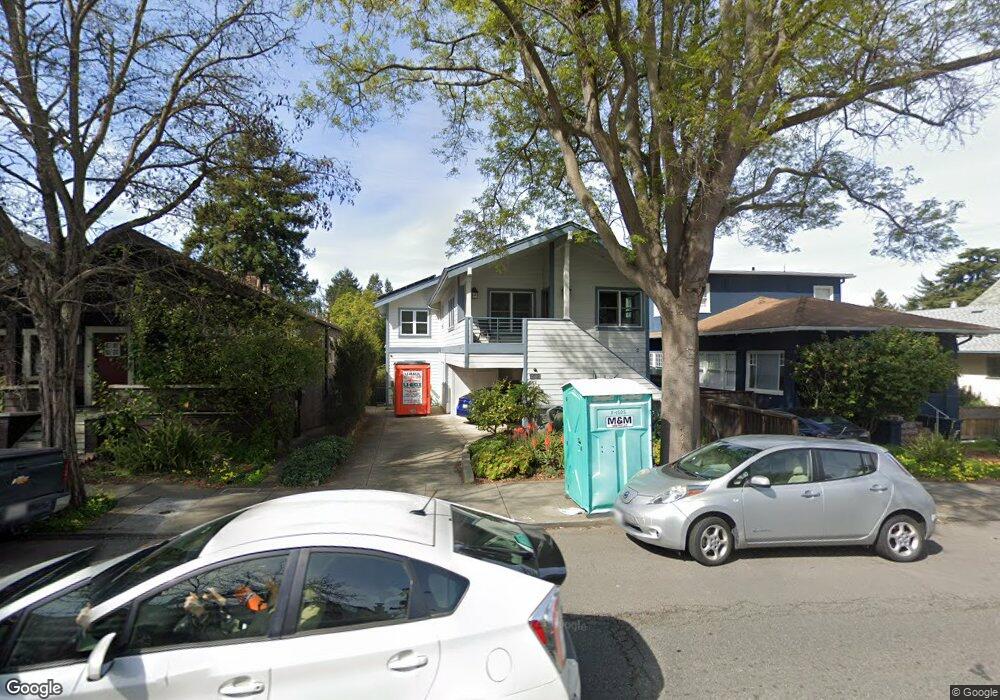
1532 Martin Luther King jr Way Unit 1 Berkeley, CA 94709
North Berkeley NeighborhoodEstimated Value: $713,000 - $963,000
2
Beds
2
Baths
1,043
Sq Ft
$807/Sq Ft
Est. Value
About This Home
This home is located at 1532 Martin Luther King jr Way Unit 1, Berkeley, CA 94709 and is currently estimated at $841,870, approximately $807 per square foot. 1532 Martin Luther King jr Way Unit 1 is a home located in Alameda County with nearby schools including Berkeley Arts Magnet at Whittier School, Washington Elementary School, and Oxford Elementary School.
Ownership History
Date
Name
Owned For
Owner Type
Purchase Details
Closed on
Nov 26, 2012
Sold by
Felt Adrienne and Murphy Mark
Bought by
Goldstein Peter A and Dekalb Dana L
Current Estimated Value
Home Financials for this Owner
Home Financials are based on the most recent Mortgage that was taken out on this home.
Original Mortgage
$417,000
Outstanding Balance
$288,368
Interest Rate
3.33%
Mortgage Type
New Conventional
Estimated Equity
$553,502
Purchase Details
Closed on
May 12, 2009
Sold by
1532 Mlk Limited Liability Company
Bought by
Felt Adrienne
Home Financials for this Owner
Home Financials are based on the most recent Mortgage that was taken out on this home.
Original Mortgage
$200,000
Interest Rate
4.82%
Mortgage Type
Purchase Money Mortgage
Create a Home Valuation Report for This Property
The Home Valuation Report is an in-depth analysis detailing your home's value as well as a comparison with similar homes in the area
Home Values in the Area
Average Home Value in this Area
Purchase History
| Date | Buyer | Sale Price | Title Company |
|---|---|---|---|
| Goldstein Peter A | $530,000 | Chicago Title Company | |
| Felt Adrienne | $555,000 | Placer Title Company |
Source: Public Records
Mortgage History
| Date | Status | Borrower | Loan Amount |
|---|---|---|---|
| Open | Goldstein Peter A | $417,000 | |
| Previous Owner | Felt Adrienne | $200,000 |
Source: Public Records
Tax History Compared to Growth
Tax History
| Year | Tax Paid | Tax Assessment Tax Assessment Total Assessment is a certain percentage of the fair market value that is determined by local assessors to be the total taxable value of land and additions on the property. | Land | Improvement |
|---|---|---|---|---|
| 2025 | $9,510 | $652,630 | $195,789 | $456,841 |
| 2024 | $9,510 | $639,837 | $191,951 | $447,886 |
| 2023 | $9,318 | $627,291 | $188,187 | $439,104 |
| 2022 | $9,165 | $614,995 | $184,498 | $430,497 |
| 2021 | $9,195 | $602,938 | $180,881 | $422,057 |
| 2020 | $8,747 | $596,758 | $179,027 | $417,731 |
| 2019 | $8,452 | $585,061 | $175,518 | $409,543 |
| 2018 | $8,320 | $573,591 | $172,077 | $401,514 |
| 2017 | $8,025 | $562,345 | $168,703 | $393,642 |
| 2016 | $7,797 | $551,321 | $165,396 | $385,925 |
| 2015 | $7,699 | $543,042 | $162,912 | $380,130 |
| 2014 | $7,658 | $532,405 | $159,721 | $372,684 |
Source: Public Records
Map
Nearby Homes
- 1841 Cedar St
- 1849 Cedar St
- 1609 Bonita Ave Unit 5
- 1642 Milvia St Unit 2
- 1906 Bonita Ave
- 1512 Walnut St
- 2117 Delaware St Unit B
- 1682 Oxford St
- 1850 Berryman St
- 1300 Martin Luther King Junior Way
- 2201 Virginia St Unit 2
- 2201 Virginia St Unit 3
- 1626 Hopkins St
- 1668 Arch St
- 1175 Colusa Ave
- 1929 California St
- 1296 Monterey Ave
- 1614 Posen Ave
- 1436 Delaware St
- 1149 Amador Ave
- 1532 Martin Luther King jr Way Unit 2
- 1532 Martin Luther King jr Way Unit 2
- 1532 Martin Luther King jr Way
- 1532 Martin Luther King jr Way Unit 3
- 1532 Martin Luther King jr Way
- 1532 Mlk jr Way Unit 1
- 1532 Mlk jr Way Unit 2
- 1532 Mlk jr Way Unit 3
- 1530 Martin Luther King jr Way
- 1534 Martin Luther King jr Way
- 1526 Martin Luther King jr Way
- 1538 Martin Luther King jr Way
- 1837 Cedar St
- 1518 Martin Luther King jr Way
- 1541 Josephine St
- 1529 Josephine St
- 1535 Martin Luther King jr Way
- 1543 Josephine St
- 1527 Josephine St
- 1537 Martin Luther King jr Way