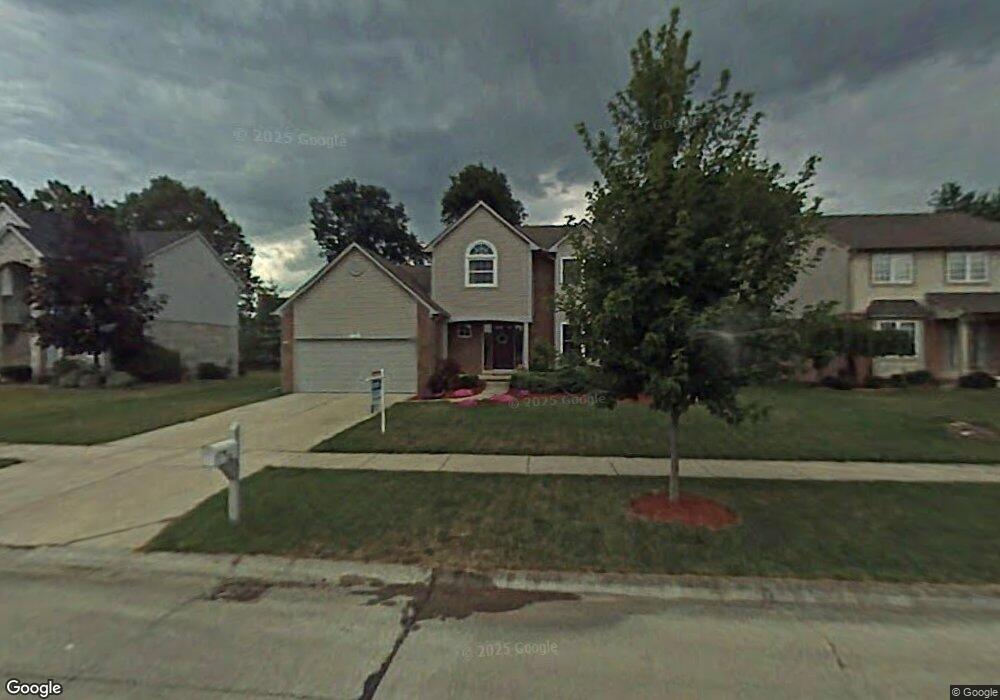
1532 Milbrook Rd Canton, MI 48188
Estimated Value: $412,000 - $493,000
Studio
3
Baths
1,901
Sq Ft
$234/Sq Ft
Est. Value
About This Home
This home is located at 1532 Milbrook Rd, Canton, MI 48188 and is currently estimated at $444,236, approximately $233 per square foot. 1532 Milbrook Rd is a home located in Wayne County with nearby schools including Canton High School, Salem High School, and Plymouth High School.
Ownership History
Date
Name
Owned For
Owner Type
Purchase Details
Closed on
Jun 11, 2021
Sold by
Duhl Lee V and Duhl Karen
Bought by
Kennan Aiman
Current Estimated Value
Home Financials for this Owner
Home Financials are based on the most recent Mortgage that was taken out on this home.
Original Mortgage
$284,800
Outstanding Balance
$210,494
Interest Rate
2.9%
Mortgage Type
New Conventional
Estimated Equity
$233,742
Purchase Details
Closed on
Aug 8, 2007
Sold by
Meese Jeffrey D and Larson Candace A
Bought by
Duhl Lee
Purchase Details
Closed on
Apr 29, 2005
Sold by
Friedman Jonathan H and Friedman Kimberley A
Bought by
Meese Jeffrey D
Home Financials for this Owner
Home Financials are based on the most recent Mortgage that was taken out on this home.
Original Mortgage
$226,000
Interest Rate
5.68%
Mortgage Type
Fannie Mae Freddie Mac
Purchase Details
Closed on
Feb 26, 2001
Sold by
Foster Kevin L
Bought by
Feeley Kimberley A
Create a Home Valuation Report for This Property
The Home Valuation Report is an in-depth analysis detailing your home's value as well as a comparison with similar homes in the area
Home Values in the Area
Average Home Value in this Area
Purchase History
| Date | Buyer | Sale Price | Title Company |
|---|---|---|---|
| Kennan Aiman | $356,000 | Fidelity National Title | |
| Duhl Lee | $245,000 | None Available | |
| Meese Jeffrey D | $282,500 | Pioneer Title Services | |
| Feeley Kimberley A | $254,000 | -- |
Source: Public Records
Mortgage History
| Date | Status | Borrower | Loan Amount |
|---|---|---|---|
| Open | Kennan Aiman | $284,800 | |
| Previous Owner | Meese Jeffrey D | $226,000 |
Source: Public Records
Tax History
| Year | Tax Paid | Tax Assessment Tax Assessment Total Assessment is a certain percentage of the fair market value that is determined by local assessors to be the total taxable value of land and additions on the property. | Land | Improvement |
|---|---|---|---|---|
| 2025 | $2,975 | $190,600 | $0 | $0 |
| 2024 | $2,890 | $163,400 | $0 | $0 |
| 2023 | $2,755 | $153,800 | $0 | $0 |
| 2022 | $5,980 | $145,300 | $0 | $0 |
| 2021 | $4,084 | $129,500 | $0 | $0 |
| 2020 | $4,033 | $124,300 | $0 | $0 |
| 2019 | $3,961 | $107,500 | $0 | $0 |
| 2018 | $1,628 | $107,690 | $0 | $0 |
| 2017 | $4,050 | $108,200 | $0 | $0 |
| 2016 | $3,602 | $114,300 | $0 | $0 |
| 2015 | $8,946 | $104,750 | $0 | $0 |
| 2013 | $8,667 | $90,330 | $0 | $0 |
| 2010 | -- | $95,000 | $47,567 | $47,433 |
Source: Public Records
Map
Nearby Homes
- 40049 Rolling Green Ct
- 569 Worthington Rd
- 2393 Arcadia Dr
- 1786 Daisey Ln Unit 32
- 2087 Arcadia Dr Unit 65
- 39209 Nottingham St
- 1260 S John Hix St
- 39615 Kirkland Dr
- 39234 Gloucester St
- 41009 Southwind Dr Unit 108
- 00000 Avondale St
- 2618 Hannan Rd
- 41060 Northwind Dr
- 41226 Southwind Dr Unit 138
- 41128 Northwind Dr Unit 28
- 352 Cherry Hill Pointe Dr Unit 33
- 0 Cherry Hill Unit 16924
- 000 S Lotz Rd
- 1878 Otter Pond Ln
- 127 S John Hix St
- 1532 Millbrook Rd
- 1500 Milbrook Rd
- 1564 Milbrook Rd
- 1500 Millbrook Rd
- 40026 Woodale Way
- 1596 Milbrook Rd
- 1468 Milbrook Rd
- 39988 Woodale Way
- 1528 Dunston Rd
- 1454 Aziz Dr
- 1437 Aziz Dr
- 39950 Woodale Way
- 1649 Millbrook Rd
- 1649 Milbrook Rd
- 1436 Milbrook Rd
- 1422 Aziz Dr
- 1405 Aziz Dr
- 1544 Dunston Rd
- 1421 Milbrook Rd
- 39912 Woodale Way
Your Personal Tour Guide
Ask me questions while you tour the home.