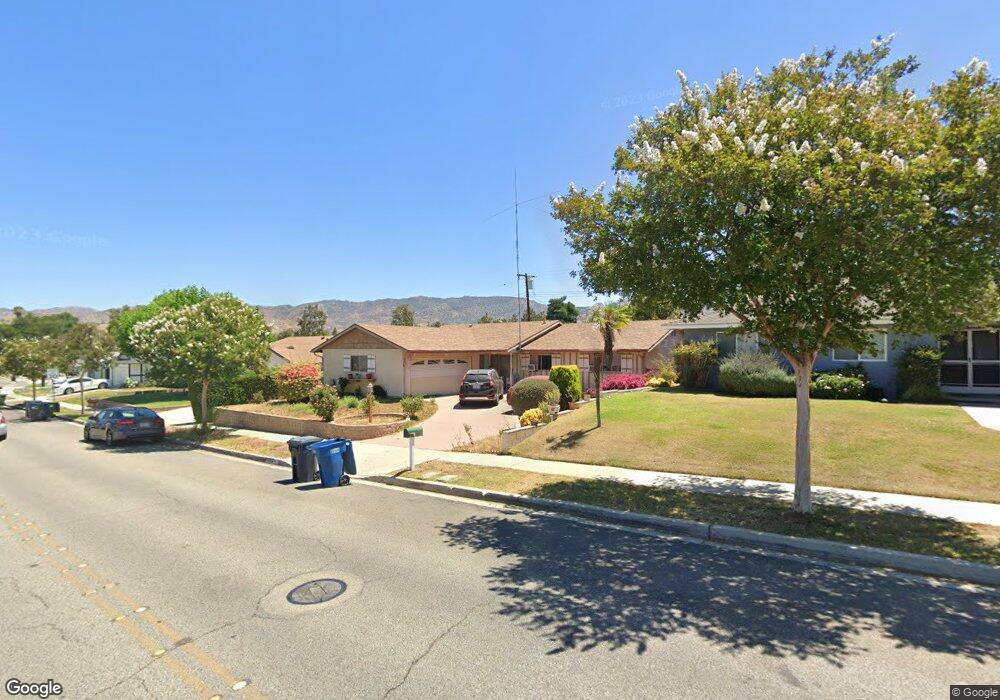
1532 Stow St Simi Valley, CA 93063
East Simi Valley NeighborhoodEstimated Value: $776,000 - $805,392
3
Beds
2
Baths
1,632
Sq Ft
$482/Sq Ft
Est. Value
About This Home
This home is located at 1532 Stow St, Simi Valley, CA 93063 and is currently estimated at $786,098, approximately $481 per square foot. 1532 Stow St is a home located in Ventura County with nearby schools including Katherine Elementary School, Valley View Middle School, and Simi Valley High School.
Ownership History
Date
Name
Owned For
Owner Type
Purchase Details
Closed on
Jan 26, 2023
Sold by
Victor Siregar Trust
Bought by
Victor Siregar Trust
Current Estimated Value
Home Financials for this Owner
Home Financials are based on the most recent Mortgage that was taken out on this home.
Original Mortgage
$1,057,500
Outstanding Balance
$1,024,796
Interest Rate
6.41%
Mortgage Type
Credit Line Revolving
Estimated Equity
-$238,698
Purchase Details
Closed on
Sep 25, 2019
Sold by
Victor Siregar
Bought by
Victor Siregar Trust
Purchase Details
Closed on
May 24, 2002
Sold by
Bell Tim
Bought by
Siregar Victor and Siregar Connie S
Home Financials for this Owner
Home Financials are based on the most recent Mortgage that was taken out on this home.
Original Mortgage
$230,500
Interest Rate
6.01%
Purchase Details
Closed on
Mar 8, 1995
Sold by
Smith Betty Burton
Bought by
Smith Betty Burton and Smith Wayne L
Create a Home Valuation Report for This Property
The Home Valuation Report is an in-depth analysis detailing your home's value as well as a comparison with similar homes in the area
Home Values in the Area
Average Home Value in this Area
Purchase History
| Date | Buyer | Sale Price | Title Company |
|---|---|---|---|
| Victor Siregar Trust | -- | Fidelity National Title | |
| Victor Siregar Trust | -- | None Listed On Document | |
| Siregar Victor | $77,000 | Stewart Title Company | |
| Smith Betty Burton | -- | -- | |
| Smith Betty Burton | -- | -- |
Source: Public Records
Mortgage History
| Date | Status | Borrower | Loan Amount |
|---|---|---|---|
| Open | Victor Siregar Trust | $1,057,500 | |
| Previous Owner | Siregar Victor | $230,500 | |
| Closed | Victor Siregar Trust | $1,057,500 |
Source: Public Records
Tax History Compared to Growth
Tax History
| Year | Tax Paid | Tax Assessment Tax Assessment Total Assessment is a certain percentage of the fair market value that is determined by local assessors to be the total taxable value of land and additions on the property. | Land | Improvement |
|---|---|---|---|---|
| 2025 | $4,680 | $368,801 | $147,520 | $221,281 |
| 2024 | $4,680 | $361,570 | $144,627 | $216,943 |
| 2023 | $4,473 | $354,481 | $141,791 | $212,690 |
| 2022 | $4,368 | $347,531 | $139,011 | $208,520 |
| 2021 | $4,325 | $340,717 | $136,285 | $204,432 |
| 2020 | $4,227 | $337,226 | $134,889 | $202,337 |
| 2019 | $4,033 | $330,615 | $132,245 | $198,370 |
| 2018 | $3,991 | $324,133 | $129,652 | $194,481 |
| 2017 | $3,896 | $317,778 | $127,110 | $190,668 |
| 2016 | $3,718 | $311,548 | $124,618 | $186,930 |
| 2015 | $3,633 | $306,871 | $122,748 | $184,123 |
| 2014 | $3,575 | $300,862 | $120,345 | $180,517 |
Source: Public Records
Map
Nearby Homes
- 5588 California Oak St
- 1768 N Geoffrey Ave
- 5474 Geoffrey Ave
- 1874 Stow St
- 5526 E Los Angeles Ave Unit 1
- 5526 E Los Angeles Ave Unit 2
- 5526 E Los Angeles Ave Unit 3
- 5526 E Los Angeles Ave Unit 4
- 5518 E Los Angeles Ave Unit 8
- 5518 E Los Angeles Ave Unit 7
- 5518 E Los Angeles Ave Unit 6
- 5518 E Los Angeles Ave Unit 5
- 5510 E Los Angeles Ave Unit 12
- 5510 E Los Angeles Ave Unit 11
- 5510 E Los Angeles Ave Unit 10
- 5510 E Los Angeles Ave Unit 9
- 5502 E Los Angeles Ave Unit 16
- 5502 E Los Angeles Ave Unit 15
- 5502 E Los Angeles Ave Unit 14
- 5502 E Los Angeles Ave Unit 13