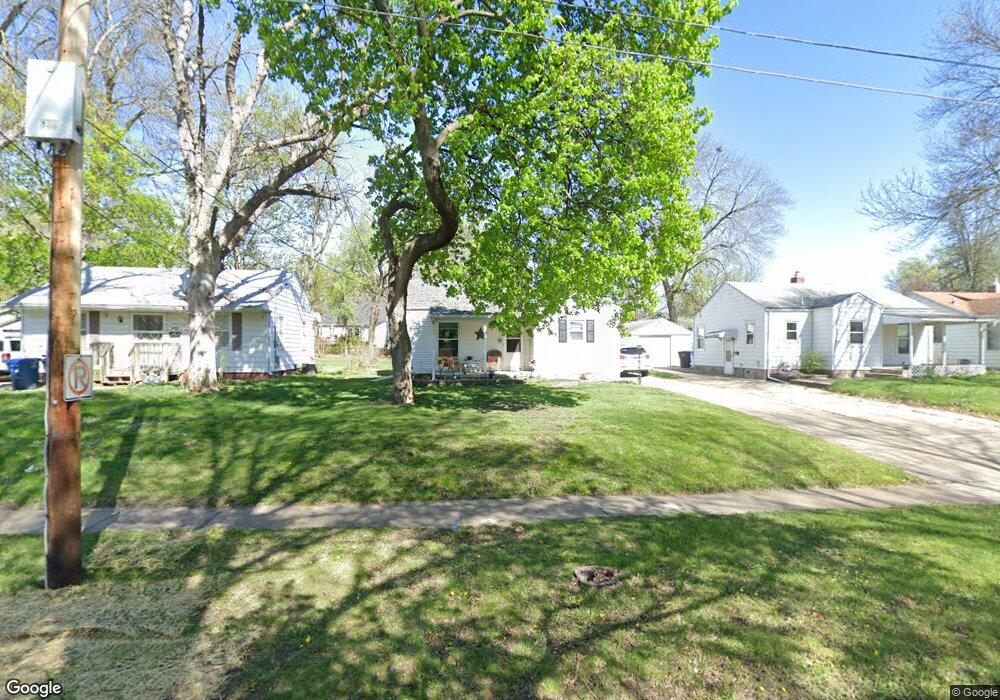
1533 56th St Des Moines, IA 50311
Merle Hay NeighborhoodEstimated Value: $184,464 - $203,000
2
Beds
1
Bath
786
Sq Ft
$245/Sq Ft
Est. Value
About This Home
This home is located at 1533 56th St, Des Moines, IA 50311 and is currently estimated at $192,366, approximately $244 per square foot. 1533 56th St is a home located in Polk County with nearby schools including Windsor Elementary School, Merrill Middle School, and Roosevelt High School.
Ownership History
Date
Name
Owned For
Owner Type
Purchase Details
Closed on
Oct 16, 2000
Sold by
Thompson Judith F
Bought by
Hunter Virginia M
Current Estimated Value
Home Financials for this Owner
Home Financials are based on the most recent Mortgage that was taken out on this home.
Original Mortgage
$58,000
Outstanding Balance
$21,212
Interest Rate
7.96%
Estimated Equity
$171,154
Purchase Details
Closed on
Dec 10, 1997
Sold by
Norwest Bank Iowa N A and Chalmers Jean Carol
Bought by
Thompson Judith F
Home Financials for this Owner
Home Financials are based on the most recent Mortgage that was taken out on this home.
Original Mortgage
$47,250
Interest Rate
6.87%
Create a Home Valuation Report for This Property
The Home Valuation Report is an in-depth analysis detailing your home's value as well as a comparison with similar homes in the area
Home Values in the Area
Average Home Value in this Area
Purchase History
| Date | Buyer | Sale Price | Title Company |
|---|---|---|---|
| Hunter Virginia M | $77,500 | -- | |
| Thompson Judith F | $62,500 | -- |
Source: Public Records
Mortgage History
| Date | Status | Borrower | Loan Amount |
|---|---|---|---|
| Open | Hunter Virginia M | $58,000 | |
| Previous Owner | Thompson Judith F | $47,250 |
Source: Public Records
Tax History Compared to Growth
Tax History
| Year | Tax Paid | Tax Assessment Tax Assessment Total Assessment is a certain percentage of the fair market value that is determined by local assessors to be the total taxable value of land and additions on the property. | Land | Improvement |
|---|---|---|---|---|
| 2025 | $2,860 | $163,100 | $40,700 | $122,400 |
| 2024 | $2,860 | $145,400 | $35,800 | $109,600 |
| 2023 | $3,024 | $145,400 | $35,800 | $109,600 |
| 2022 | $3,000 | $128,300 | $32,300 | $96,000 |
| 2021 | $2,862 | $128,300 | $32,300 | $96,000 |
| 2020 | $2,974 | $114,700 | $28,800 | $85,900 |
| 2019 | $2,758 | $114,700 | $28,800 | $85,900 |
| 2018 | $2,730 | $102,600 | $25,100 | $77,500 |
| 2017 | $2,450 | $102,600 | $25,100 | $77,500 |
| 2016 | $2,388 | $90,600 | $21,900 | $68,700 |
| 2015 | $2,388 | $90,600 | $21,900 | $68,700 |
| 2014 | $2,240 | $87,500 | $20,700 | $66,800 |
Source: Public Records
Map
Nearby Homes