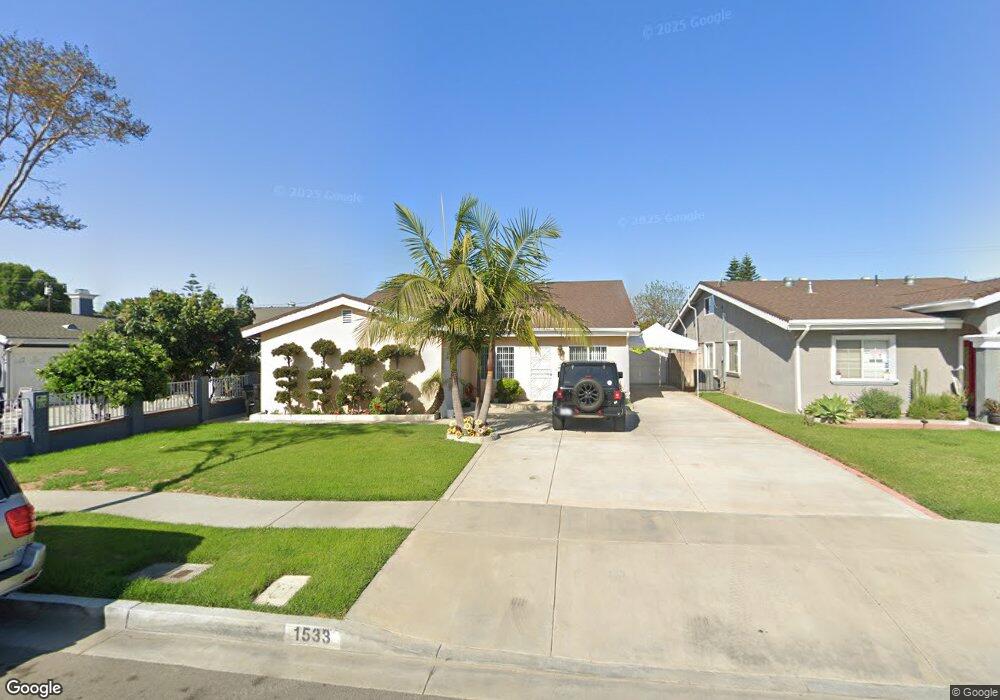
1533 Havenpark Ave South El Monte, CA 91733
Estimated Value: $778,000 - $1,096,000
4
Beds
2
Baths
2,592
Sq Ft
$347/Sq Ft
Est. Value
About This Home
This home is located at 1533 Havenpark Ave, South El Monte, CA 91733 and is currently estimated at $898,420, approximately $346 per square foot. 1533 Havenpark Ave is a home located in Los Angeles County with nearby schools including Dean L. Shively Middle School, New Temple Elementary School, and South El Monte High School.
Ownership History
Date
Name
Owned For
Owner Type
Purchase Details
Closed on
Oct 5, 2005
Sold by
Jarquin Isidra
Bought by
Altamirano Balfre
Current Estimated Value
Purchase Details
Closed on
Sep 9, 2003
Sold by
Nunez Ignacio
Bought by
Nunez Roberto
Home Financials for this Owner
Home Financials are based on the most recent Mortgage that was taken out on this home.
Original Mortgage
$220,000
Outstanding Balance
$101,566
Interest Rate
6.17%
Mortgage Type
Purchase Money Mortgage
Estimated Equity
$796,854
Purchase Details
Closed on
Mar 2, 1995
Sold by
Emc Mtg Corp
Bought by
Ramirez Alberto
Home Financials for this Owner
Home Financials are based on the most recent Mortgage that was taken out on this home.
Original Mortgage
$128,000
Interest Rate
8.6%
Purchase Details
Closed on
Dec 1, 1993
Sold by
Great Western Bank Fsb
Bought by
Emc Mtg Corp
Create a Home Valuation Report for This Property
The Home Valuation Report is an in-depth analysis detailing your home's value as well as a comparison with similar homes in the area
Home Values in the Area
Average Home Value in this Area
Purchase History
| Date | Buyer | Sale Price | Title Company |
|---|---|---|---|
| Altamirano Balfre | -- | Fidelity National Title Co | |
| Nunez Roberto | -- | Chicago Title Co | |
| Ramirez Alberto | $163,000 | Fidelity National Title | |
| Emc Mtg Corp | $100,000 | Fidelity National Title |
Source: Public Records
Mortgage History
| Date | Status | Borrower | Loan Amount |
|---|---|---|---|
| Open | Nunez Roberto | $220,000 | |
| Closed | Ramirez Alberto | $128,000 |
Source: Public Records
Tax History Compared to Growth
Tax History
| Year | Tax Paid | Tax Assessment Tax Assessment Total Assessment is a certain percentage of the fair market value that is determined by local assessors to be the total taxable value of land and additions on the property. | Land | Improvement |
|---|---|---|---|---|
| 2025 | $4,256 | $340,884 | $132,178 | $208,706 |
| 2024 | $4,256 | $334,201 | $129,587 | $204,614 |
| 2023 | $4,150 | $327,649 | $127,047 | $200,602 |
| 2022 | $4,077 | $321,225 | $124,556 | $196,669 |
| 2021 | $4,011 | $314,927 | $122,114 | $192,813 |
| 2019 | $4,029 | $305,588 | $118,493 | $187,095 |
| 2018 | $3,798 | $299,597 | $116,170 | $183,427 |
| 2016 | $3,614 | $287,965 | $111,660 | $176,305 |
| 2015 | $3,577 | $283,640 | $109,983 | $173,657 |
| 2014 | $3,504 | $278,085 | $107,829 | $170,256 |
Source: Public Records
Map
Nearby Homes
- 10146 Alpaca St
- 1517 Merced Ave Unit 52
- 1517 Merced Ave Unit 43
- 1517 Merced Ave Unit 56
- 1318 Merced Ave
- 4003 Valley Oak Ln Unit B
- 4003 Valley Oak Ln Unit C
- 4003 Valley Oak Ln Unit D
- 4001 Valley Oak Ln Unit D
- 4001 Valley Oak Ln Unit C
- 4003 Valley Oak Ln Unit E
- 4003 Valley Oak Ln Unit F
- 4003 Valley Oak Ln Unit G
- 4003 Valley Oak Ln Unit H
- 4003 Valley Oak Ln Unit A
- 4001 Valley Oak Ln Unit B
- 4001 Valley Oak Ln Unit E
- 1236 Kruse Dr
- 10839 Skyline Dr
- 1227 Esteban Torres Dr
- 1537 Havenpark Ave
- 1527 Havenpark Ave
- 1543 Havenpark Ave
- 1523 Havenpark Ave
- 1508 Millet Ave
- 1512 Millet Ave
- 1502 Millet Ave
- 1549 Havenpark Ave
- 1518 Millet Ave
- 1454 Millet Ave
- 1517 Havenpark Ave
- 1532 Havenpark Ave
- 1522 Havenpark Ave
- 1536 Havenpark Ave
- 1524 Millet Ave
- 1448 Millet Ave
- 1555 Havenpark Ave
- 1542 Havenpark Ave
- 1513 Havenpark Ave
- 1548 Havenpark Ave