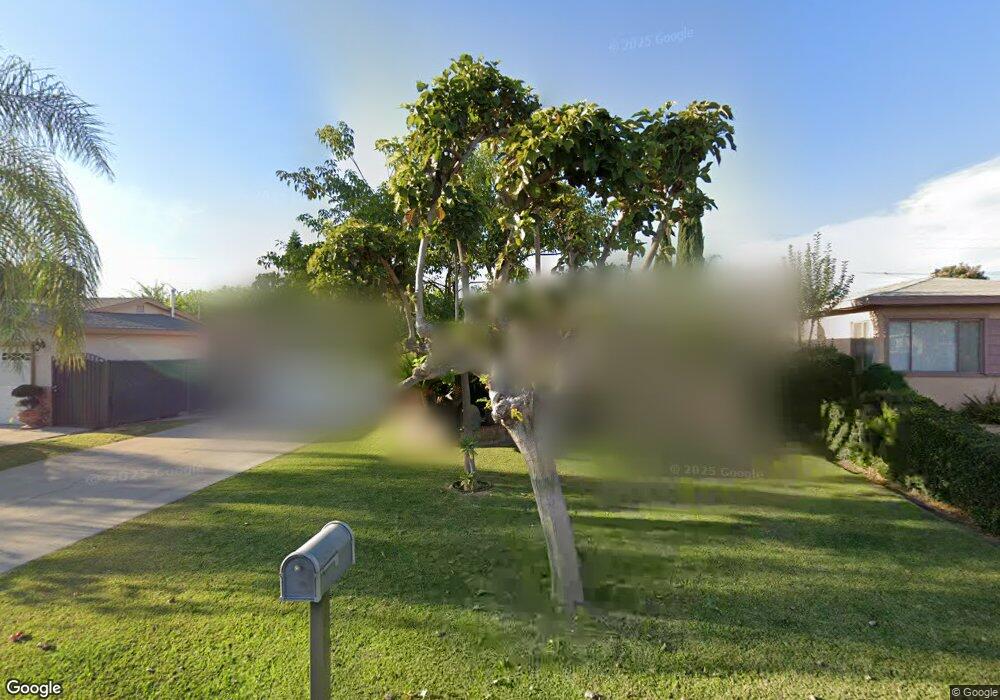
1533 N Stimson Ave La Puente, CA 91744
Estimated Value: $669,619 - $678,000
3
Beds
2
Baths
960
Sq Ft
$702/Sq Ft
Est. Value
About This Home
This home is located at 1533 N Stimson Ave, La Puente, CA 91744 and is currently estimated at $673,655, approximately $701 per square foot. 1533 N Stimson Ave is a home located in Los Angeles County with nearby schools including Baldwin Academy, Grandview College Preparatory Academy, and William Workman High School.
Ownership History
Date
Name
Owned For
Owner Type
Purchase Details
Closed on
May 23, 2020
Sold by
Hereby Martha S Felix
Bought by
Felix Martha S and Martha S Felix Trust
Current Estimated Value
Purchase Details
Closed on
Jun 19, 2003
Sold by
Felix Amador N and Felix Martha Sylvia
Bought by
Felix Martha Sylvia
Home Financials for this Owner
Home Financials are based on the most recent Mortgage that was taken out on this home.
Original Mortgage
$156,000
Outstanding Balance
$66,299
Interest Rate
5.37%
Mortgage Type
Purchase Money Mortgage
Estimated Equity
$607,356
Purchase Details
Closed on
Feb 14, 1995
Sold by
Bluestein Jack
Bought by
Felix Amador N and Felix Martha Sylvia
Home Financials for this Owner
Home Financials are based on the most recent Mortgage that was taken out on this home.
Original Mortgage
$109,254
Interest Rate
7.97%
Mortgage Type
FHA
Create a Home Valuation Report for This Property
The Home Valuation Report is an in-depth analysis detailing your home's value as well as a comparison with similar homes in the area
Home Values in the Area
Average Home Value in this Area
Purchase History
| Date | Buyer | Sale Price | Title Company |
|---|---|---|---|
| Felix Martha S | -- | None Available | |
| Felix Martha Sylvia | -- | Landamerica Lawyers Title | |
| Felix Amador N | $110,000 | Gateway Title Company |
Source: Public Records
Mortgage History
| Date | Status | Borrower | Loan Amount |
|---|---|---|---|
| Open | Felix Martha Sylvia | $156,000 | |
| Previous Owner | Felix Amador N | $109,254 |
Source: Public Records
Tax History
| Year | Tax Paid | Tax Assessment Tax Assessment Total Assessment is a certain percentage of the fair market value that is determined by local assessors to be the total taxable value of land and additions on the property. | Land | Improvement |
|---|---|---|---|---|
| 2025 | $3,393 | $260,069 | $200,469 | $59,600 |
| 2024 | $3,393 | $254,971 | $196,539 | $58,432 |
| 2023 | $3,306 | $249,973 | $192,686 | $57,287 |
| 2022 | $3,211 | $245,072 | $188,908 | $56,164 |
| 2021 | $3,151 | $240,267 | $185,204 | $55,063 |
| 2019 | $3,061 | $233,142 | $179,711 | $53,431 |
| 2018 | $2,955 | $228,572 | $176,188 | $52,384 |
| 2016 | $2,741 | $219,698 | $169,348 | $50,350 |
| 2015 | $2,689 | $216,399 | $166,805 | $49,594 |
| 2014 | $2,651 | $212,161 | $163,538 | $48,623 |
Source: Public Records
Map
Nearby Homes
- 15629 Alwood St
- 1139 Aldgate Ave
- 1420 Glenshaw Dr
- 1133 Aldgate Ave
- 1123 Aldgate Ave
- 940 W Bainbridge Ave
- 15426 Hayland St
- 1215 W Windsor St
- 1334 S Glendora Ave
- 15014 Ragus St
- 1084 Del Valle Ave
- 15937 Maplegrove St
- 1225 W Glenmere St
- 14809 Dancer St
- 15509 Amar Rd
- 15739 Amar Rd
- 1115 E Truman Place
- 15865 Cadwell St
- 902 Ballista Ave
- 938 Evanwood Ave
- 1539 N Stimson Ave
- 1527 N Stimson Ave
- 1521 N Stimson Ave
- 1545 N Stimson Ave
- 1544 N Hacienda Blvd
- 1550 N Hacienda Blvd
- 1538 N Hacienda Blvd
- 1556 N Hacienda Blvd
- 1551 N Stimson Ave
- 1517 N Stimson Ave
- 1532 N Hacienda Blvd
- 1536 N Stimson Ave
- 15502 Briarbank St
- 1522 N Stimson Ave
- 1562 N Hacienda Blvd
- 1526 N Hacienda Blvd
- 1603 N Stimson Ave
- 1511 N Stimson Ave
- 15510 Briarbank St
Your Personal Tour Guide
Ask me questions while you tour the home.