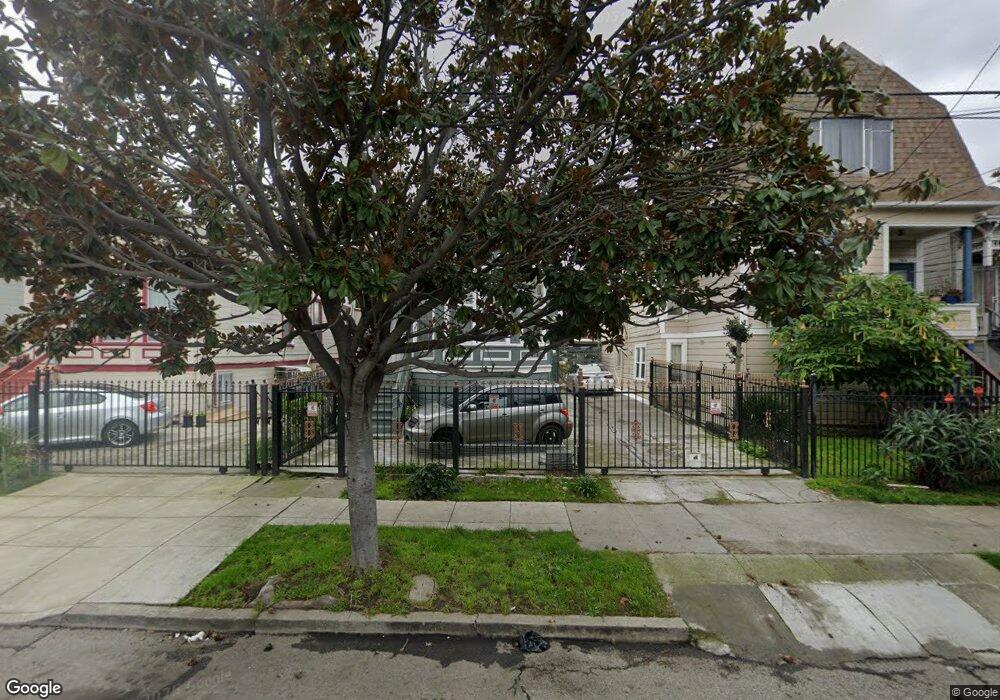
1534 7th Ave Oakland, CA 94606
Clinton NeighborhoodEstimated Value: $587,000 - $682,000
2
Beds
7
Baths
1,096
Sq Ft
$563/Sq Ft
Est. Value
About This Home
This home is located at 1534 7th Ave, Oakland, CA 94606 and is currently estimated at $616,929, approximately $562 per square foot. 1534 7th Ave is a home located in Alameda County with nearby schools including Franklin Elementary School, Roosevelt Middle School, and Oakland High School.
Ownership History
Date
Name
Owned For
Owner Type
Purchase Details
Closed on
Jan 15, 2002
Sold by
Vannguyen Manh Van
Bought by
Phung Yen
Current Estimated Value
Home Financials for this Owner
Home Financials are based on the most recent Mortgage that was taken out on this home.
Original Mortgage
$74,000
Interest Rate
7.11%
Purchase Details
Closed on
Nov 26, 1997
Sold by
Hassen Abdel and Hassen Fatima
Bought by
Phung Yen
Home Financials for this Owner
Home Financials are based on the most recent Mortgage that was taken out on this home.
Original Mortgage
$72,800
Interest Rate
7.31%
Create a Home Valuation Report for This Property
The Home Valuation Report is an in-depth analysis detailing your home's value as well as a comparison with similar homes in the area
Home Values in the Area
Average Home Value in this Area
Purchase History
We collect this data history from publicly available records. To have your information removed, we recommend requesting removal directly through your county’s website.
| Date | Buyer | Sale Price | Title Company |
|---|---|---|---|
| Phung Yen | -- | Fidelity National Title Co | |
| Phung Yen | $104,000 | Placer Title Company |
Source: Public Records
Mortgage History
We collect this data history from publicly available records. To have your information removed, we recommend requesting removal directly through your county’s website.
| Date | Status | Borrower | Loan Amount |
|---|---|---|---|
| Closed | Phung Yen | $74,000 | |
| Closed | Phung Yen | $72,800 |
Source: Public Records
Tax History
| Year | Tax Paid | Tax Assessment Tax Assessment Total Assessment is a certain percentage of the fair market value that is determined by local assessors to be the total taxable value of land and additions on the property. | Land | Improvement |
|---|---|---|---|---|
| 2025 | $3,812 | $159,053 | $49,816 | $116,237 |
| 2024 | $3,812 | $155,797 | $48,839 | $113,958 |
| 2023 | $3,892 | $159,606 | $47,882 | $111,724 |
| 2022 | $3,849 | $149,477 | $46,943 | $109,534 |
| 2021 | $3,428 | $146,408 | $46,022 | $107,386 |
| 2020 | $3,387 | $151,836 | $45,551 | $106,285 |
| 2019 | $3,175 | $148,860 | $44,658 | $104,202 |
| 2018 | $3,111 | $145,941 | $43,782 | $102,159 |
| 2017 | $2,960 | $143,080 | $42,924 | $100,156 |
| 2016 | $2,780 | $140,275 | $42,082 | $98,193 |
| 2015 | $2,761 | $138,168 | $41,450 | $96,718 |
| 2014 | $2,692 | $135,462 | $40,638 | $94,824 |
Source: Public Records
Map
Nearby Homes
- 635 E 15th St
- 1547 8th Ave
- 1439 7th Ave
- 1428 6th Ave
- 1625 7th Ave
- 1549 5th Ave
- 1806 8th Ave
- 414 E 12th St
- 1005 E 12th St
- 1004 9th Ave
- 425 E 11th St Unit 6
- 1011 E 11th St
- 832 7th Ave
- 1155 International Blvd
- 252 International Blvd Unit 303
- 1911 5th Ave
- 220 International Blvd
- 1130 E 11th St
- 530 E 8th St Unit 207
- 1504 13th Ave
Your Personal Tour Guide
Ask me questions while you tour the home.