
Seller's Agent in 2025
Steven Wener
eXp Realty of California, Inc.
(760) 300-9166
4 in this area
77 Total Sales

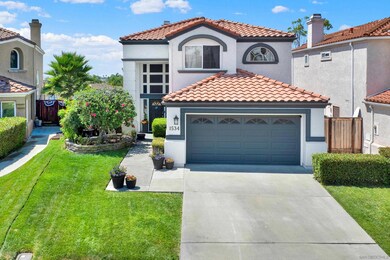
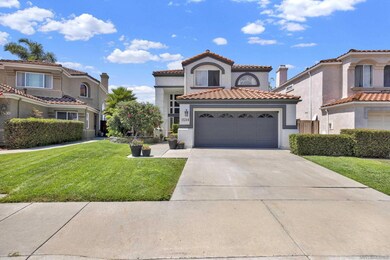
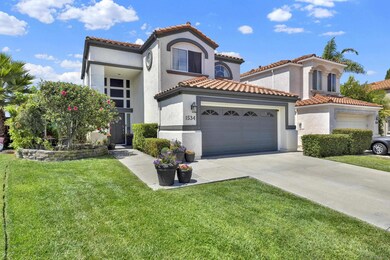
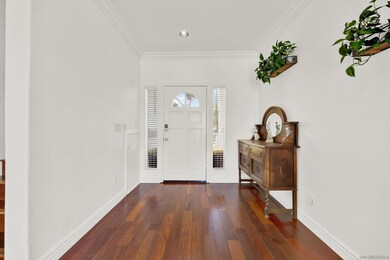
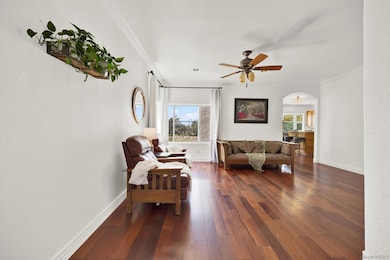
Welcome to this beautifully maintained 5-bedroom, 3-bathroom home offering 2,263 sq. ft. of living space in a desirable Oceanside neighborhood with ocean views on a clear day. The inviting floor plan features a bright living area with wood flooring, abundant natural light, and a cozy fireplace. The spacious kitchen is a chef’s delight with rich wood cabinetry, granite countertops, a large center island, and a professional-grade gas range. Upstairs, the primary suite boasts vaulted ceilings and a remodeled bath with dual vanities, a soaking tub, separate walk-in shower, and generous closet space. The upstairs has a second primary bedroom set up. Additional bedrooms are well sized for family, home office, or hobbies. The private backyard is designed for easy maintenance with artificial turf, paver patio, and ample space for entertaining. Situated close to parks, schools, shopping, and just minutes from the beach, this home combines comfort, style, and the best of coastal living.
Last Agent to Sell the Property
eXp Realty of California, Inc. License #01874599 Listed on: 09/02/2025
| Date | Type | Sale Price | Title Company |
|---|---|---|---|
| Grant Deed | $1,005,000 | Ticor Title Company | |
| Grant Deed | -- | Ticor Title Company | |
| Grant Deed | -- | None Available | |
| Interfamily Deed Transfer | -- | South Coast Title Company | |
| Individual Deed | $197,000 | South Coast Title Company | |
| Grant Deed | $179,000 | Continental Lawyers Title Co |
| Date | Status | Loan Amount | Loan Type |
|---|---|---|---|
| Open | $502,500 | New Conventional | |
| Previous Owner | $157,600 | No Value Available | |
| Previous Owner | $169,950 | No Value Available |
| Date | Event | Price | List to Sale | Price per Sq Ft |
|---|---|---|---|---|
| 09/29/2025 09/29/25 | Sold | $1,005,000 | +1.0% | $444 / Sq Ft |
| 09/14/2025 09/14/25 | Pending | -- | -- | -- |
| 09/02/2025 09/02/25 | For Sale | $995,000 | -- | $440 / Sq Ft |
| Year | Tax Paid | Tax Assessment Tax Assessment Total Assessment is a certain percentage of the fair market value that is determined by local assessors to be the total taxable value of land and additions on the property. | Land | Improvement |
|---|---|---|---|---|
| 2025 | $3,756 | $345,712 | $110,164 | $235,548 |
| 2024 | $3,756 | $338,934 | $108,004 | $230,930 |
| 2023 | $3,639 | $332,289 | $105,887 | $226,402 |
| 2022 | $3,582 | $325,774 | $103,811 | $221,963 |
| 2021 | $3,595 | $319,387 | $101,776 | $217,611 |
| 2020 | $3,483 | $316,113 | $100,733 | $215,380 |
| 2019 | $3,381 | $309,915 | $98,758 | $211,157 |
| 2018 | $3,350 | $303,839 | $96,822 | $207,017 |
| 2017 | $3,288 | $297,882 | $94,924 | $202,958 |
| 2016 | $3,179 | $292,042 | $93,063 | $198,979 |
| 2015 | $3,086 | $287,657 | $91,666 | $195,991 |
| 2014 | $2,966 | $282,023 | $89,871 | $192,152 |
Seller's Agent in 2025
Steven Wener
eXp Realty of California, Inc.
(760) 300-9166
4 in this area
77 Total Sales
Buyer's Agent in 2025
Nick Wright
Compass
(760) 518-7240
3 in this area
90 Total Sales
Source: San Diego MLS
MLS Number: 250037812
APN: 161-651-78
Disclaimer: Certain information contained herein is derived from information provided by parties other than Homes.com. All information provided is deemed reliable, but is not guaranteed to be accurate and should be independently verified.
![]() This information is deemed reliable but not guaranteed. You should rely on this information only to decide whether or not to further investigate a particular property.
This information is deemed reliable but not guaranteed. You should rely on this information only to decide whether or not to further investigate a particular property.
BEFORE MAKING ANY OTHER DECISION, YOU SHOULD PERSONALLY INVESTIGATE THE FACTS (e.g. square footage and lot size) with the assistance of an appropriate professional. You may use this information only to identify properties you may be interested in investigating further. All uses except for personal, noncommercial use in accordance with the foregoing purpose are prohibited. Redistribution or copying of this information, any photographs or video tours is strictly
prohibited. This information is derived from the Internet Data Exchange (IDX) service provided by San Diego MLS. Displayed property listings may be held by a brokerage firm other than the broker and/or agent responsible for this display. The information and any photographs and video tours and the compilation from which they are derived is protected by copyright. Compilation © 2026 San Diego MLS.
Ask me questions while you tour the home.