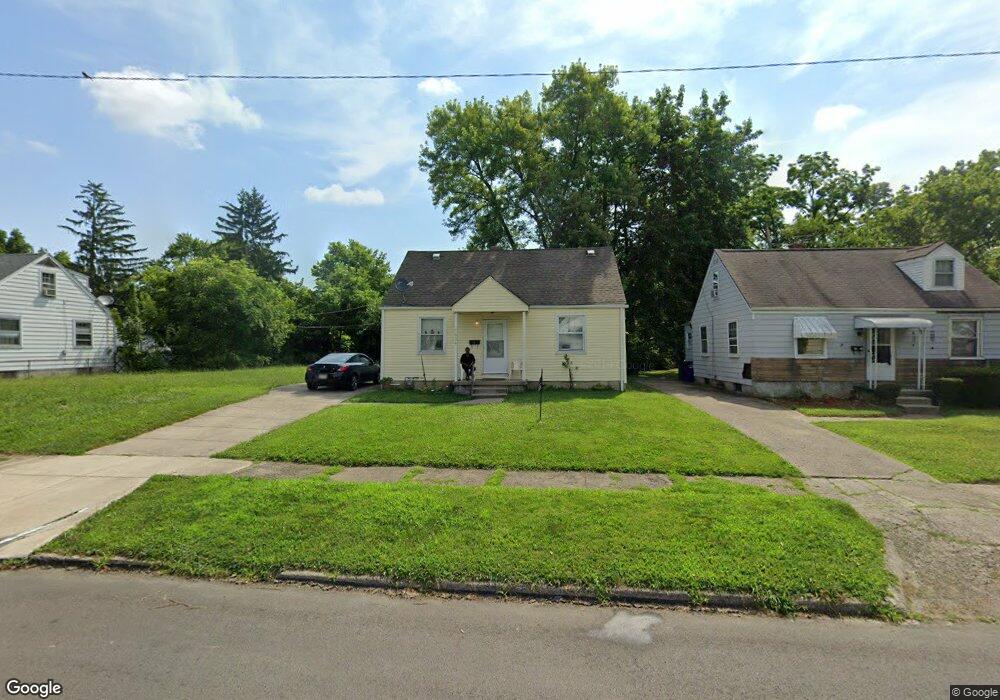
1534 Kipling Dr Dayton, OH 45406
Cornell Heights NeighborhoodEstimated Value: $64,123 - $88,000
2
Beds
1
Bath
900
Sq Ft
$85/Sq Ft
Est. Value
About This Home
This home is located at 1534 Kipling Dr, Dayton, OH 45406 and is currently estimated at $76,281, approximately $84 per square foot. 1534 Kipling Dr is a home located in Montgomery County with nearby schools including Valerie Elementary School, Dayton Leadership Academies, and Deca Prep.
Ownership History
Date
Name
Owned For
Owner Type
Purchase Details
Closed on
May 23, 2003
Sold by
Wells Fargo Bank Minnesota Na
Bought by
Weber James T
Current Estimated Value
Purchase Details
Closed on
Jan 23, 2003
Sold by
Franklin Davenia
Bought by
Wells Fargo Bank Minnesota Na
Purchase Details
Closed on
Jan 7, 2003
Sold by
Franklin Davenia and Franklin Rhonda
Bought by
Wells Fargo Bank Minnesota Na and Option One Mortgage Loan Trust 2000-B
Purchase Details
Closed on
Apr 10, 2001
Sold by
Wilson Charles
Bought by
Franklin Rhonda and Franklin Davenia
Home Financials for this Owner
Home Financials are based on the most recent Mortgage that was taken out on this home.
Original Mortgage
$36,831
Interest Rate
7.05%
Mortgage Type
Balloon
Purchase Details
Closed on
Oct 13, 2000
Sold by
Ocwen Federal Bank Fsb
Bought by
Wilson Charles
Purchase Details
Closed on
Aug 25, 2000
Sold by
Glover K Dianna
Bought by
Ocwen Federal Bank Fsb
Purchase Details
Closed on
Aug 18, 2000
Sold by
Glover K Dianna
Bought by
Ocwen Federal Bank Fsb
Create a Home Valuation Report for This Property
The Home Valuation Report is an in-depth analysis detailing your home's value as well as a comparison with similar homes in the area
Home Values in the Area
Average Home Value in this Area
Purchase History
| Date | Buyer | Sale Price | Title Company |
|---|---|---|---|
| Weber James T | $16,500 | Resource Title Agency Inc | |
| Wells Fargo Bank Minnesota Na | $28,000 | -- | |
| Wells Fargo Bank Minnesota Na | $28,000 | -- | |
| Franklin Rhonda | $46,100 | Evans Title Agency Inc | |
| Wilson Charles | $9,000 | -- | |
| Ocwen Federal Bank Fsb | $19,975 | -- | |
| Ocwen Federal Bank Fsb | $19,975 | -- |
Source: Public Records
Mortgage History
| Date | Status | Borrower | Loan Amount |
|---|---|---|---|
| Previous Owner | Franklin Rhonda | $36,831 | |
| Previous Owner | Franklin Rhonda | $6,906 |
Source: Public Records
Tax History
| Year | Tax Paid | Tax Assessment Tax Assessment Total Assessment is a certain percentage of the fair market value that is determined by local assessors to be the total taxable value of land and additions on the property. | Land | Improvement |
|---|---|---|---|---|
| 2025 | $646 | $10,660 | $2,780 | $7,880 |
| 2024 | $630 | $10,660 | $2,780 | $7,880 |
| 2023 | $630 | $10,660 | $2,780 | $7,880 |
| 2022 | $808 | $10,660 | $2,780 | $7,880 |
| 2021 | $804 | $10,660 | $2,780 | $7,880 |
| 2020 | $803 | $10,660 | $2,780 | $7,880 |
| 2019 | $697 | $8,230 | $3,460 | $4,770 |
| 2018 | $698 | $8,230 | $3,460 | $4,770 |
| 2017 | $693 | $8,230 | $3,460 | $4,770 |
| 2016 | $705 | $8,190 | $3,460 | $4,730 |
| 2015 | $668 | $8,190 | $3,460 | $4,730 |
| 2014 | $668 | $8,190 | $3,460 | $4,730 |
| 2012 | -- | $12,330 | $4,320 | $8,010 |
Source: Public Records
Map
Nearby Homes
- 3250 Campus Dr
- 1424 Shaftesbury Rd
- 3007 Cornell Dr
- 1365 Alcott Dr
- 3644 Karwin Dr Unit 3638
- 1430 Tennyson Ave
- 1341 Shaftesbury Rd
- 3231 Harvard Blvd
- 3120 Harvard Blvd
- 1720 Wesleyan Rd
- 3306 Otterbein Ave
- 1716 Parkhill Dr
- 3118 Athens Ave
- 2820 Harvard Blvd
- 1628 Philadelphia Dr
- 2807 Athens Ave
- 1215 Philadelphia Dr
- 1935 Philadelphia Dr
- 1820 Rutland Dr
- 520 Alameda Place
- 1528 Kipling Dr
- 1524 Kipling Dr
- 1546 Kipling Dr
- 1520 Kipling Dr
- 1531 Shelley Dr
- 1535 Shelley Dr
- 1527 Shelley Dr
- 1541 Shelley Dr
- 1550 Kipling Dr
- 1525 Shelley Dr
- 1516 Kipling Dr
- 1545 Shelley Dr
- 1535 Kipling Dr
- 1539 Kipling Dr
- 1531 Kipling Dr
- 3320 Cornell Dr
- 1521 Shelley Dr
- 1541 Kipling Dr
- 1549 Shelley Dr
- 1525 Kipling Dr
Your Personal Tour Guide
Ask me questions while you tour the home.