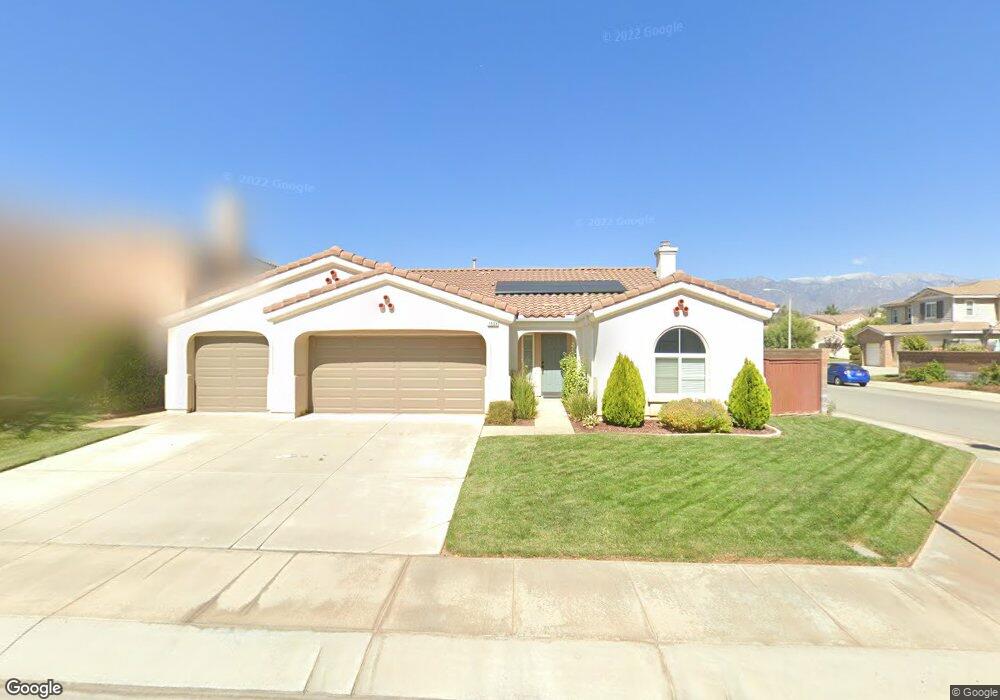
1534 Polaris Ln Beaumont, CA 92223
Estimated Value: $532,393 - $564,000
4
Beds
3
Baths
2,306
Sq Ft
$238/Sq Ft
Est. Value
About This Home
This home is located at 1534 Polaris Ln, Beaumont, CA 92223 and is currently estimated at $548,098, approximately $237 per square foot. 1534 Polaris Ln is a home located in Riverside County with nearby schools including Sundance Elementary School, San Gorgonio Middle School, and Beaumont Senior High School.
Ownership History
Date
Name
Owned For
Owner Type
Purchase Details
Closed on
Oct 18, 2023
Sold by
Smith Beverly L
Bought by
Beverly L Smith Living Trust and Smith
Current Estimated Value
Purchase Details
Closed on
Mar 8, 2010
Sold by
Rodgers Donald and Rodgers Sherrye
Bought by
Smith Beverly L
Home Financials for this Owner
Home Financials are based on the most recent Mortgage that was taken out on this home.
Original Mortgage
$191,468
Interest Rate
5.25%
Mortgage Type
FHA
Purchase Details
Closed on
Jul 6, 2006
Sold by
Pardee Homes
Bought by
Rodgers Donald and Rodgers Sherrye
Home Financials for this Owner
Home Financials are based on the most recent Mortgage that was taken out on this home.
Original Mortgage
$294,687
Interest Rate
6.12%
Mortgage Type
Purchase Money Mortgage
Create a Home Valuation Report for This Property
The Home Valuation Report is an in-depth analysis detailing your home's value as well as a comparison with similar homes in the area
Home Values in the Area
Average Home Value in this Area
Purchase History
| Date | Buyer | Sale Price | Title Company |
|---|---|---|---|
| Beverly L Smith Living Trust | -- | None Listed On Document | |
| Smith Beverly L | $195,000 | Chicago Title Inland Empire | |
| Rodgers Donald | $421,000 | Chicago Title Company |
Source: Public Records
Mortgage History
| Date | Status | Borrower | Loan Amount |
|---|---|---|---|
| Previous Owner | Smith Beverly L | $191,468 | |
| Previous Owner | Rodgers Donald | $294,687 |
Source: Public Records
Tax History Compared to Growth
Tax History
| Year | Tax Paid | Tax Assessment Tax Assessment Total Assessment is a certain percentage of the fair market value that is determined by local assessors to be the total taxable value of land and additions on the property. | Land | Improvement |
|---|---|---|---|---|
| 2025 | $5,407 | $251,692 | $70,985 | $180,707 |
| 2023 | $5,407 | $241,921 | $68,230 | $173,691 |
| 2022 | $5,298 | $237,179 | $66,893 | $170,286 |
| 2021 | $5,239 | $232,530 | $65,582 | $166,948 |
| 2020 | $5,195 | $230,147 | $64,910 | $165,237 |
| 2019 | $5,131 | $225,636 | $63,638 | $161,998 |
| 2018 | $5,139 | $221,213 | $62,391 | $158,822 |
| 2017 | $5,309 | $216,876 | $61,168 | $155,708 |
| 2016 | $5,882 | $212,624 | $59,969 | $152,655 |
| 2015 | $5,778 | $209,432 | $59,069 | $150,363 |
| 2014 | $5,720 | $205,331 | $57,913 | $147,418 |
Source: Public Records
Map
Nearby Homes
- 1560 Polaris Ln
- 912 Anser Ln
- 1649 Rigel St
- 1489 Bottlebrush Ct
- 901 Blue Orchid
- 770 Allegheny St
- 1548 Hunter Moon Way
- 625 Xenia Ave
- 1161 Richland Dr
- 1461 Liatris Way
- 1490 E 6th St Unit 7
- 1490 E 6th St Unit 16
- 1256 Sunburst Dr
- 1460 E 6th St Unit 4
- Mariposa Plan 3 at Atwell - Rosetta
- Willow Plan 3 at Atwell - Landmark
- Ivy Plan 2 at Atwell - Ciena
- Linden Plan 3 at Atwell - Southcreek
- Alpine Plan 1 at Atwell - Southcreek
- Alder Plan 2 at Atwell - Rosetta
- 1526 Polaris Ln
- 1540 Phoenix Dr
- 1544 Polaris Ln
- 1535 Polaris Ln
- 1527 Polaris Ln
- 1544 Phoenix Dr
- 920 Del Sol Way
- 1549 Phoenix Dr
- 1541 Polaris Ln
- 928 Del Sol Way
- 1523 Polaris Ln
- 1554 Polaris Ln
- 934 Del Sol Way
- 1547 Polaris Ln
- 1548 Phoenix Dr
- 1519 Polaris Ln
- 938 Del Sol Way
- 1550 Phoenix Dr
- 1561 Phoenix Dr
- 1559 Polaris Ln