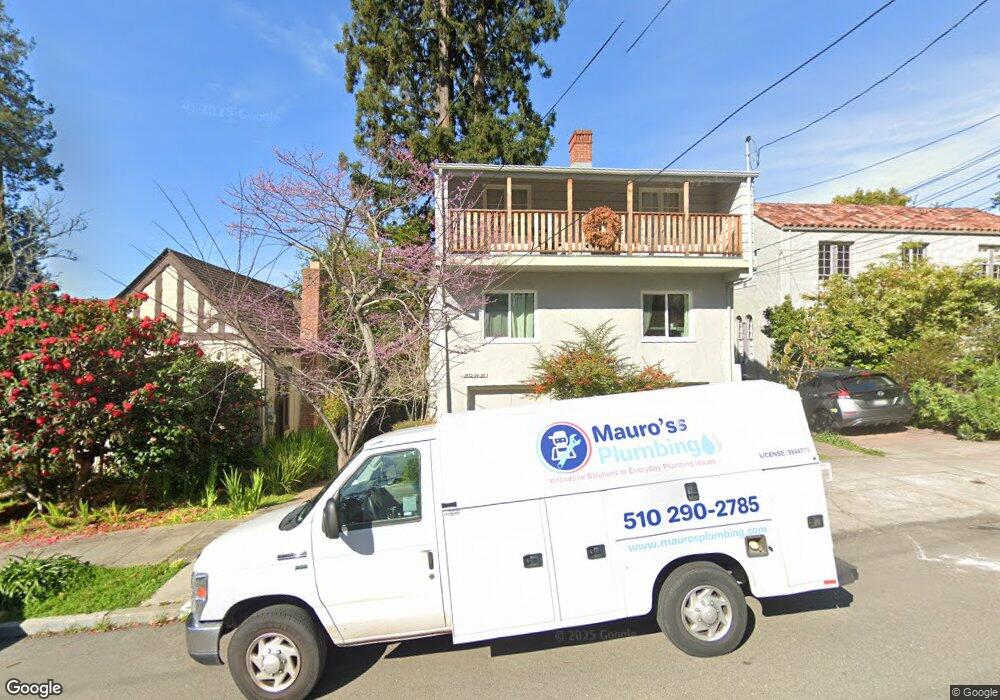
1534 Scenic Ave Unit 2 Berkeley, CA 94708
North Berkeley NeighborhoodEstimated Value: $1,021,000 - $1,460,846
3
Beds
2
Baths
2,023
Sq Ft
$627/Sq Ft
Est. Value
About This Home
This home is located at 1534 Scenic Ave Unit 2, Berkeley, CA 94708 and is currently estimated at $1,267,962, approximately $626 per square foot. 1534 Scenic Ave Unit 2 is a home located in Alameda County with nearby schools including Berkeley Arts Magnet at Whittier School, Cragmont Elementary School, and Washington Elementary School.
Ownership History
Date
Name
Owned For
Owner Type
Purchase Details
Closed on
Sep 25, 2007
Sold by
Chamberlain Jack G and Chamberlain Harriet S
Bought by
Campbell Matthew and Rashid Shahla
Current Estimated Value
Home Financials for this Owner
Home Financials are based on the most recent Mortgage that was taken out on this home.
Original Mortgage
$680,000
Outstanding Balance
$430,946
Interest Rate
6.5%
Mortgage Type
Purchase Money Mortgage
Estimated Equity
$837,016
Purchase Details
Closed on
Jan 27, 1995
Sold by
Chamberlain Jack G and Chamberlain Harriet S
Bought by
Chamberlain Jack G and Chamberlain Harriet S
Purchase Details
Closed on
Aug 4, 1994
Sold by
Chamberlain Jack and Chamberlain Harriet
Bought by
Chamberlain Jack and Chamberlain Harriet
Create a Home Valuation Report for This Property
The Home Valuation Report is an in-depth analysis detailing your home's value as well as a comparison with similar homes in the area
Home Values in the Area
Average Home Value in this Area
Purchase History
| Date | Buyer | Sale Price | Title Company |
|---|---|---|---|
| Campbell Matthew | $850,000 | Old Republic Title Company | |
| Chamberlain Jack G | -- | -- | |
| Chamberlain Jack | -- | First American Title Guarant |
Source: Public Records
Mortgage History
| Date | Status | Borrower | Loan Amount |
|---|---|---|---|
| Open | Campbell Matthew | $680,000 |
Source: Public Records
Tax History
| Year | Tax Paid | Tax Assessment Tax Assessment Total Assessment is a certain percentage of the fair market value that is determined by local assessors to be the total taxable value of land and additions on the property. | Land | Improvement |
|---|---|---|---|---|
| 2025 | $16,596 | $1,123,156 | $334,924 | $788,232 |
| 2024 | $16,596 | $1,101,137 | $328,358 | $772,779 |
| 2023 | $16,260 | $1,079,554 | $321,922 | $757,632 |
| 2022 | $15,985 | $1,058,388 | $315,610 | $742,778 |
| 2021 | $16,036 | $1,037,643 | $309,424 | $728,219 |
| 2020 | $15,203 | $1,027,005 | $306,252 | $720,753 |
| 2019 | $14,639 | $1,006,875 | $300,249 | $706,626 |
| 2018 | $14,405 | $987,139 | $294,364 | $692,775 |
| 2017 | $13,923 | $967,787 | $288,593 | $679,194 |
| 2016 | $13,503 | $948,812 | $282,935 | $665,877 |
| 2015 | $13,329 | $934,565 | $278,686 | $655,879 |
| 2014 | $13,246 | $916,265 | $273,229 | $643,036 |
Source: Public Records
Map
Nearby Homes
- 1622 Scenic Ave
- 1515 Oxford St Unit 1D
- 2421 Hilgard Ave
- 2301 Virginia St Unit 1
- 2340 Virginia St
- 2477 Virginia St
- 2201 Virginia St Unit 2
- 1682 Oxford St
- 1444 Walnut St
- 2451 Le Conte Ave
- 1739 Spruce St
- 2501 Rose Walk
- 2600 Hilgard Ave
- 2634 Virginia St Unit 33
- 1408 Henry St
- 1698 La Loma Ave Unit 1698
- 2035 Francisco St
- 1610 Milvia St
- 2700 Le Conte Ave Unit 301
- 2700 Le Conte Ave Unit 402
- 1532 Scenic Ave Unit 1
- 1536 Scenic Ave Unit 3
- 1524 Scenic Ave
- 1540 Scenic Ave
- 1516 Scenic Ave
- 1548 Scenic Ave
- 2340 Vine St
- 1554 Scenic Ave
- 2330 Vine St
- 1511 Arch St
- 1537 Scenic Ave
- 1515 Arch St
- 1545 Scenic Ave
- 1525 Scenic Ave
- 1519 Arch St
- 1505 Arch St
- 1515 Scenic Ave
- 1560 Scenic Ave
- 1525 Arch St
- 1525 Arch St Unit 2
Your Personal Tour Guide
Ask me questions while you tour the home.