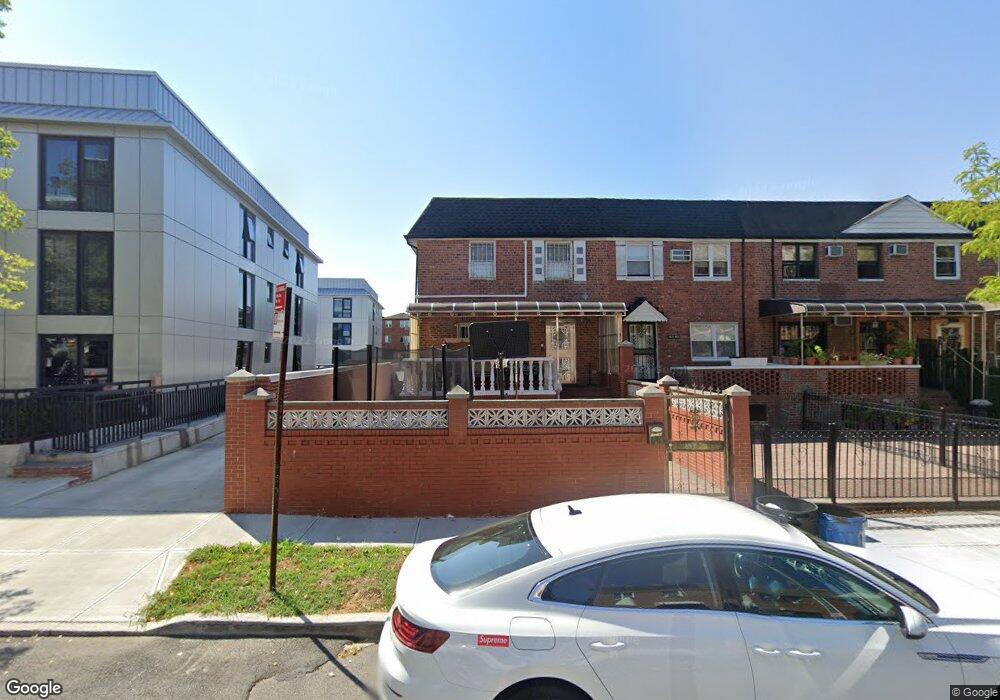
15344 76th Rd Flushing, NY 11367
Kew Gardens Hills NeighborhoodEstimated Value: $991,000 - $1,013,000
Studio
--
Bath
1,980
Sq Ft
$508/Sq Ft
Est. Value
About This Home
This home is located at 15344 76th Rd, Flushing, NY 11367 and is currently estimated at $1,005,658, approximately $507 per square foot. 15344 76th Rd is a home located in Queens County with nearby schools including P.S. 154, I.S. 250 - The Robert F. Kennedy Community Middle School, and Al-Mamoor School.
Ownership History
Date
Name
Owned For
Owner Type
Purchase Details
Closed on
Jun 28, 2024
Sold by
Khaimov Artem and Yagudayeva Nina
Bought by
Chen Dong Lin and Wang Min
Current Estimated Value
Home Financials for this Owner
Home Financials are based on the most recent Mortgage that was taken out on this home.
Original Mortgage
$220,000
Outstanding Balance
$217,002
Interest Rate
7.03%
Mortgage Type
Purchase Money Mortgage
Estimated Equity
$788,656
Purchase Details
Closed on
Jun 7, 2012
Sold by
Mirzakandov Ksio and Mirzakandov Yan
Bought by
Khaimov Artem and Yagudayeva Nina
Home Financials for this Owner
Home Financials are based on the most recent Mortgage that was taken out on this home.
Original Mortgage
$286,000
Interest Rate
3.84%
Mortgage Type
New Conventional
Purchase Details
Closed on
May 7, 2002
Sold by
Yaloz Meir and Yaloz Doreen
Bought by
Mirzakandov Yan and Mirzakandov Ksio
Home Financials for this Owner
Home Financials are based on the most recent Mortgage that was taken out on this home.
Original Mortgage
$281,250
Interest Rate
6.79%
Create a Home Valuation Report for This Property
The Home Valuation Report is an in-depth analysis detailing your home's value as well as a comparison with similar homes in the area
Home Values in the Area
Average Home Value in this Area
Purchase History
| Date | Buyer | Sale Price | Title Company |
|---|---|---|---|
| Chen Dong Lin | $998,000 | -- | |
| Chen Dong Lin | $998,000 | -- | |
| Khaimov Artem | $440,000 | -- | |
| Khaimov Artem | $440,000 | -- | |
| Mirzakandov Yan | -- | -- | |
| Mirzakandov Yan | -- | -- |
Source: Public Records
Mortgage History
| Date | Status | Borrower | Loan Amount |
|---|---|---|---|
| Open | Chen Dong Lin | $220,000 | |
| Closed | Chen Dong Lin | $220,000 | |
| Previous Owner | Khaimov Artem | $286,000 | |
| Previous Owner | Mirzakandov Yan | $281,250 |
Source: Public Records
Tax History
| Year | Tax Paid | Tax Assessment Tax Assessment Total Assessment is a certain percentage of the fair market value that is determined by local assessors to be the total taxable value of land and additions on the property. | Land | Improvement |
|---|---|---|---|---|
| 2025 | $6,716 | $36,924 | $11,069 | $25,855 |
| 2024 | $6,728 | $34,836 | $11,777 | $23,059 |
| 2023 | $6,716 | $34,836 | $12,062 | $22,774 |
| 2022 | $6,725 | $51,480 | $17,160 | $34,320 |
| 2021 | $6,568 | $53,400 | $17,160 | $36,240 |
| 2020 | $6,217 | $51,780 | $17,160 | $34,620 |
| 2019 | $5,780 | $50,760 | $17,160 | $33,600 |
| 2018 | $5,620 | $29,030 | $9,318 | $19,712 |
| 2017 | $5,573 | $28,809 | $11,907 | $16,902 |
| 2016 | $5,124 | $28,809 | $11,907 | $16,902 |
| 2015 | $3,058 | $25,642 | $13,523 | $12,119 |
| 2014 | $3,058 | $24,192 | $14,379 | $9,813 |
Source: Public Records
Map
Nearby Homes
- 153-44 77th Ave
- 15353 77th Ave Unit 3E
- 7548 Parsons Blvd Unit 2A
- 15062 77th Ave
- 158-18 77th Ave
- 150-43 77th Rd
- 75-22 Parsons Blvd Unit D3
- 150-66 78th Ave
- 158-36 77th Rd
- 150-22 77th Ave
- 150-25 77th Rd
- 150-20 77th Ave
- 15315 79th Ave
- 15307 79th Ave
- 150 E 78th St Unit DPH 11B
- 160-06 75th Rd Fesh Meadow Unit 3
- 160-20 76th Ave
- 16030 76th Ave
- 158-16 79th Ave Unit 411n
- 77-10 162nd St
- 153-44 76th Rd
- 15342 76th Rd
- 15340 76th Rd
- 15338 76th Rd
- 153-38 76th Rd
- 15338 76th Rd
- 15338 76th Rd
- 15336 76th Rd
- 15337 77th Ave
- 15334 76th Rd
- 15339 77th Ave
- 153-52 76th Rd
- 153-52 76th Rd Unit CF2
- 153-52 76th Rd Unit CF1
- 153-52 76th Rd Unit 3H
- 153-52 76th Rd Unit 1B
- 153-52 76th Rd Unit 3D
- 153-52 76th Rd Unit 3E
- 153-52 76th Rd Unit 3C
- 153-52 76th Rd Unit 2I
Your Personal Tour Guide
Ask me questions while you tour the home.