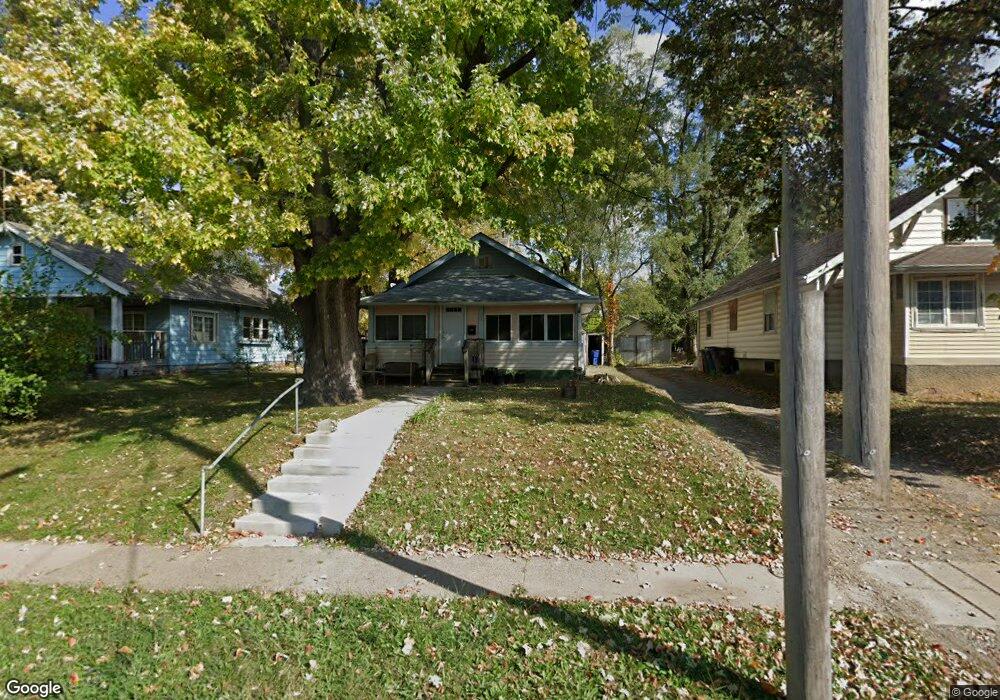
1535 19th St Des Moines, IA 50314
King Irving NeighborhoodEstimated Value: $83,000 - $159,000
2
Beds
1
Bath
720
Sq Ft
$159/Sq Ft
Est. Value
About This Home
This home is located at 1535 19th St, Des Moines, IA 50314 and is currently estimated at $114,299, approximately $158 per square foot. 1535 19th St is a home located in Polk County with nearby schools including King Elementary School, Meredith Middle School, and Hoover High School.
Ownership History
Date
Name
Owned For
Owner Type
Purchase Details
Closed on
Sep 17, 2022
Sold by
Rose Bright
Bought by
Next Dimension Trucking Llc
Current Estimated Value
Purchase Details
Closed on
Mar 25, 2014
Sold by
Samann L C
Bought by
1St Place Home Buyers L L C
Purchase Details
Closed on
Apr 26, 2012
Sold by
Grinnell State Bank
Bought by
1St Place Home Buyers Llc
Purchase Details
Closed on
Aug 24, 2001
Sold by
Scott Roger A and Scott Jacqulyn J
Bought by
Bright Virgil and Bright Rose
Purchase Details
Closed on
Apr 24, 2000
Sold by
Dettwiller William E and Dettwiller June Y
Bought by
Scott Roger A and Scott Jacqulyn J
Purchase Details
Closed on
Jan 24, 1990
Sold by
Dettwiller William E and Dettwiller June Y
Bought by
Scott Roger and Scott Jacqulyn
Home Financials for this Owner
Home Financials are based on the most recent Mortgage that was taken out on this home.
Original Mortgage
$7,000
Interest Rate
10%
Create a Home Valuation Report for This Property
The Home Valuation Report is an in-depth analysis detailing your home's value as well as a comparison with similar homes in the area
Home Values in the Area
Average Home Value in this Area
Purchase History
| Date | Buyer | Sale Price | Title Company |
|---|---|---|---|
| Next Dimension Trucking Llc | -- | -- | |
| 1St Place Home Buyers L L C | $25,000 | None Available | |
| 1St Place Home Buyers Llc | -- | None Available | |
| Bright Virgil | $14,500 | -- | |
| Scott Roger A | $6,500 | -- | |
| Scott Roger | $7,000 | -- |
Source: Public Records
Mortgage History
| Date | Status | Borrower | Loan Amount |
|---|---|---|---|
| Previous Owner | Scott Roger | $7,000 |
Source: Public Records
Tax History Compared to Growth
Tax History
| Year | Tax Paid | Tax Assessment Tax Assessment Total Assessment is a certain percentage of the fair market value that is determined by local assessors to be the total taxable value of land and additions on the property. | Land | Improvement |
|---|---|---|---|---|
| 2025 | $912 | $54,400 | $12,300 | $42,100 |
| 2024 | $912 | $46,400 | $10,500 | $35,900 |
| 2023 | $600 | $46,400 | $10,500 | $35,900 |
| 2022 | $592 | $34,300 | $8,000 | $26,300 |
| 2021 | $544 | $34,300 | $8,000 | $26,300 |
| 2020 | $560 | $30,400 | $7,100 | $23,300 |
| 2019 | $512 | $30,400 | $7,100 | $23,300 |
| 2018 | $502 | $27,600 | $6,400 | $21,200 |
| 2017 | $514 | $27,600 | $6,400 | $21,200 |
| 2016 | $494 | $27,500 | $6,300 | $21,200 |
| 2015 | $494 | $27,500 | $6,300 | $21,200 |
| 2014 | $464 | $26,200 | $6,600 | $19,600 |
Source: Public Records
Map
Nearby Homes
- 1534 18th St
- 1457 17th St
- 1716 Mondamin Ave
- 1429 Martin Luther King jr Pkwy
- 1603 Clark St
- 1434 Martin Luther King Junior Pkwy
- 1608 Mondamin Ave
- 1622 Martin Luther King Junior Pkwy
- 1513 College Ave
- 1514 Harrison Ave
- 1656 Martin Luther King Junior Pkwy
- 1605 22nd St
- 1414 Harrison Ave
- 2103 Washington Ave
- 1341 Clark St
- 1513 Washington Ave
- 1559 23rd St
- 1330 Clark St
- 1347 Forest Ave
- 1334 Washington Ave