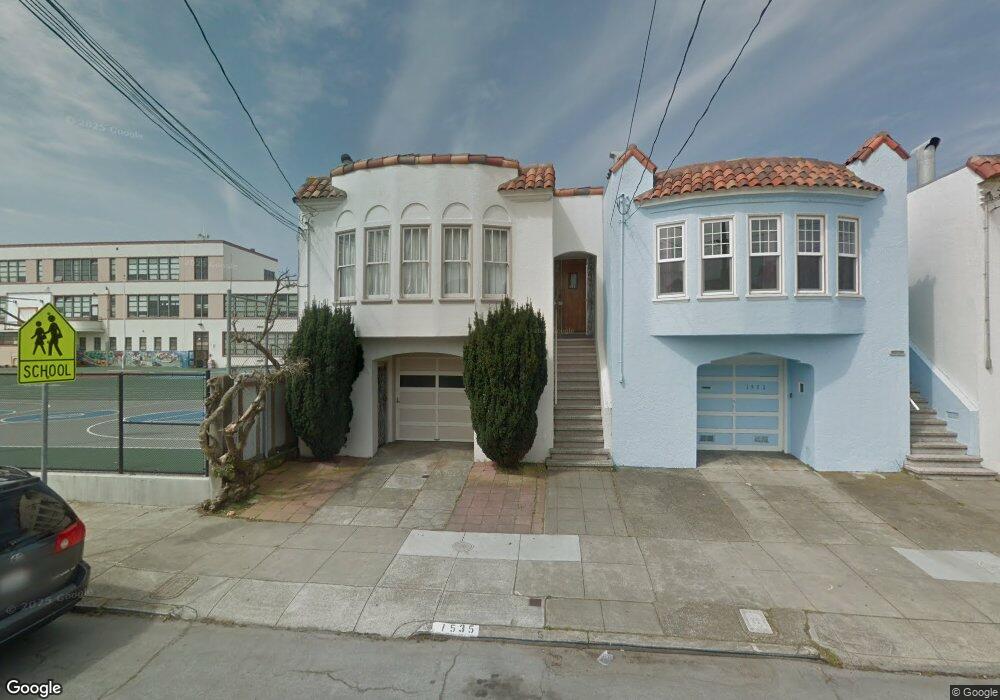
1535 30th Ave San Francisco, CA 94122
Central Sunset NeighborhoodEstimated Value: $1,602,000 - $2,259,000
4
Beds
3
Baths
2,390
Sq Ft
$774/Sq Ft
Est. Value
About This Home
This home is located at 1535 30th Ave, San Francisco, CA 94122 and is currently estimated at $1,850,463, approximately $774 per square foot. 1535 30th Ave is a home located in San Francisco County with nearby schools including Stevenson (Robert Louis) Elementary School, Giannini (A.P.) Middle School, and Cornerstone Academy-Lawton Campus.
Ownership History
Date
Name
Owned For
Owner Type
Purchase Details
Closed on
Apr 14, 2006
Sold by
Lin Wen Chen
Bought by
Hung Yao Wei
Current Estimated Value
Home Financials for this Owner
Home Financials are based on the most recent Mortgage that was taken out on this home.
Original Mortgage
$417,000
Outstanding Balance
$238,666
Interest Rate
6.29%
Mortgage Type
Fannie Mae Freddie Mac
Estimated Equity
$1,611,797
Purchase Details
Closed on
Feb 27, 1996
Sold by
Hung Tao Yuan
Bought by
Hung Yao Wei
Create a Home Valuation Report for This Property
The Home Valuation Report is an in-depth analysis detailing your home's value as well as a comparison with similar homes in the area
Home Values in the Area
Average Home Value in this Area
Purchase History
| Date | Buyer | Sale Price | Title Company |
|---|---|---|---|
| Hung Yao Wei | -- | United Independent Title | |
| Hung Yao Wei | $280,000 | -- |
Source: Public Records
Mortgage History
| Date | Status | Borrower | Loan Amount |
|---|---|---|---|
| Open | Hung Yao Wei | $417,000 |
Source: Public Records
Tax History Compared to Growth
Tax History
| Year | Tax Paid | Tax Assessment Tax Assessment Total Assessment is a certain percentage of the fair market value that is determined by local assessors to be the total taxable value of land and additions on the property. | Land | Improvement |
|---|---|---|---|---|
| 2025 | $8,552 | $666,596 | $349,547 | $317,049 |
| 2024 | $8,552 | $653,527 | $342,694 | $310,833 |
| 2023 | $8,372 | $640,714 | $335,975 | $304,739 |
| 2022 | $8,195 | $628,153 | $329,388 | $298,765 |
| 2021 | $8,048 | $615,838 | $322,930 | $292,908 |
| 2020 | $8,147 | $609,524 | $319,619 | $289,905 |
| 2019 | $7,874 | $597,574 | $313,352 | $284,222 |
| 2018 | $7,609 | $585,858 | $307,208 | $278,650 |
| 2017 | $7,222 | $574,372 | $301,185 | $273,187 |
| 2016 | $5,575 | $435,143 | $295,280 | $139,863 |
| 2015 | $5,503 | $428,608 | $290,845 | $137,763 |
| 2014 | $5,361 | $420,213 | $285,148 | $135,065 |
Source: Public Records
Map
Nearby Homes