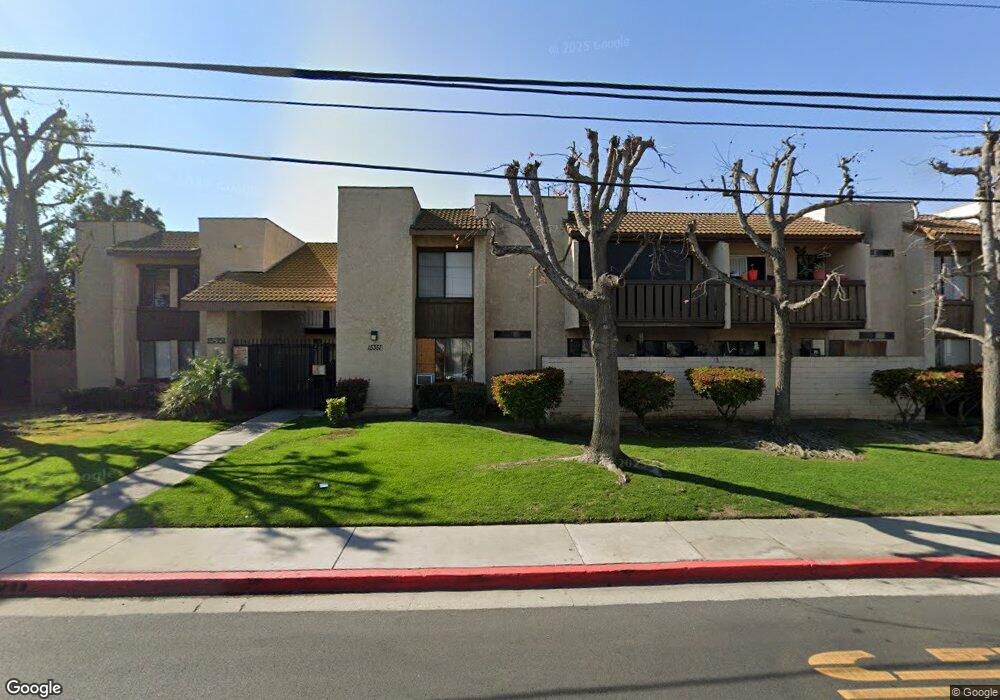
15351 Orange Ave Unit 24 Paramount, CA 90723
Estimated Value: $404,883 - $441,000
2
Beds
2
Baths
837
Sq Ft
$501/Sq Ft
Est. Value
About This Home
This home is located at 15351 Orange Ave Unit 24, Paramount, CA 90723 and is currently estimated at $419,721, approximately $501 per square foot. 15351 Orange Ave Unit 24 is a home located in Los Angeles County with nearby schools including Mark Keppel School, Frank J. Zamboni School, and Paramount High School.
Ownership History
Date
Name
Owned For
Owner Type
Purchase Details
Closed on
Oct 6, 2003
Sold by
Kang Nancy and Orange Trust
Bought by
Joong & Yoon Kang General Partnership
Current Estimated Value
Home Financials for this Owner
Home Financials are based on the most recent Mortgage that was taken out on this home.
Original Mortgage
$126,003
Outstanding Balance
$59,042
Interest Rate
6.27%
Mortgage Type
FHA
Estimated Equity
$360,679
Purchase Details
Closed on
Jun 24, 2002
Sold by
Witty Laurel M
Bought by
Kang Nancy and Orange Trust
Purchase Details
Closed on
Jun 17, 1996
Sold by
Danhash Saadallah
Bought by
Witty Laurel M
Home Financials for this Owner
Home Financials are based on the most recent Mortgage that was taken out on this home.
Original Mortgage
$87,650
Interest Rate
8.03%
Mortgage Type
FHA
Create a Home Valuation Report for This Property
The Home Valuation Report is an in-depth analysis detailing your home's value as well as a comparison with similar homes in the area
Home Values in the Area
Average Home Value in this Area
Purchase History
| Date | Buyer | Sale Price | Title Company |
|---|---|---|---|
| Joong & Yoon Kang General Partnership | -- | New Century Title | |
| Sahagun Francisco | $130,000 | New Century Title | |
| Kang Nancy | $91,227 | -- | |
| Witty Laurel M | $90,000 | Fidelity Title | |
| Danhash Saadallah | -- | Fidelity Title |
Source: Public Records
Mortgage History
| Date | Status | Borrower | Loan Amount |
|---|---|---|---|
| Open | Sahagun Francisco | $126,003 | |
| Previous Owner | Witty Laurel M | $87,650 |
Source: Public Records
Tax History
| Year | Tax Paid | Tax Assessment Tax Assessment Total Assessment is a certain percentage of the fair market value that is determined by local assessors to be the total taxable value of land and additions on the property. | Land | Improvement |
|---|---|---|---|---|
| 2025 | $2,637 | $184,813 | $42,642 | $142,171 |
| 2024 | $2,637 | $181,190 | $41,806 | $139,384 |
| 2023 | $2,590 | $177,638 | $40,987 | $136,651 |
| 2022 | $2,522 | $174,156 | $40,184 | $133,972 |
| 2021 | $2,464 | $170,743 | $39,397 | $131,346 |
| 2019 | $2,518 | $165,681 | $38,230 | $127,451 |
| 2018 | $2,345 | $162,433 | $37,481 | $124,952 |
| 2016 | $2,112 | $156,127 | $36,027 | $120,100 |
| 2015 | $1,998 | $153,782 | $35,486 | $118,296 |
| 2014 | $2,047 | $150,770 | $34,791 | $115,979 |
Source: Public Records
Map
Nearby Homes
- 15351 Orange Ave Unit 17
- 15325 Orange Ave
- 15137 Gundry Ave Unit F
- 7032 Somerset Blvd
- 6733 Caro St Unit 47
- 6542 San Luis St
- 14944 Texaco Ave
- 16101 Ansmith Ave
- 6556 San Vincente St
- 6824 Marcelle St
- 6535 E 72nd St Unit 1
- 1050 E 72nd St
- 7229 Jackson St
- 15211 S Gibson Ave
- 16600 Orange Ave Unit 124
- 16600 Orange Ave Unit 146
- 16600 Orange Ave Unit 130
- 16600 Orange Ave Unit 48
- 16600 Orange Ave Unit 77
- 6656 Rosecrans Ave Unit N-10
- 15351 Orange Ave
- 15351 Orange Ave Unit 27
- 15351 Orange Ave Unit 4
- 15351 Orange Ave Unit 3
- 15351 Orange Ave Unit 1
- 15351 Orange Ave Unit 32
- 15351 Orange Ave Unit 31
- 15351 Orange Ave Unit 30
- 15351 Orange Ave Unit 29
- 15351 Orange Ave Unit 28
- 15351 Orange Ave Unit 26
- 15351 Orange Ave Unit 23
- 15351 Orange Ave Unit 22
- 15351 Orange Ave Unit 21
- 15351 Orange Ave Unit 20
- 15351 Orange Ave Unit 19
- 15351 Orange Ave Unit 18
- 15351 Orange Ave Unit 16
- 15351 Orange Ave Unit 15
- 15351 Orange Ave Unit 14
Your Personal Tour Guide
Ask me questions while you tour the home.