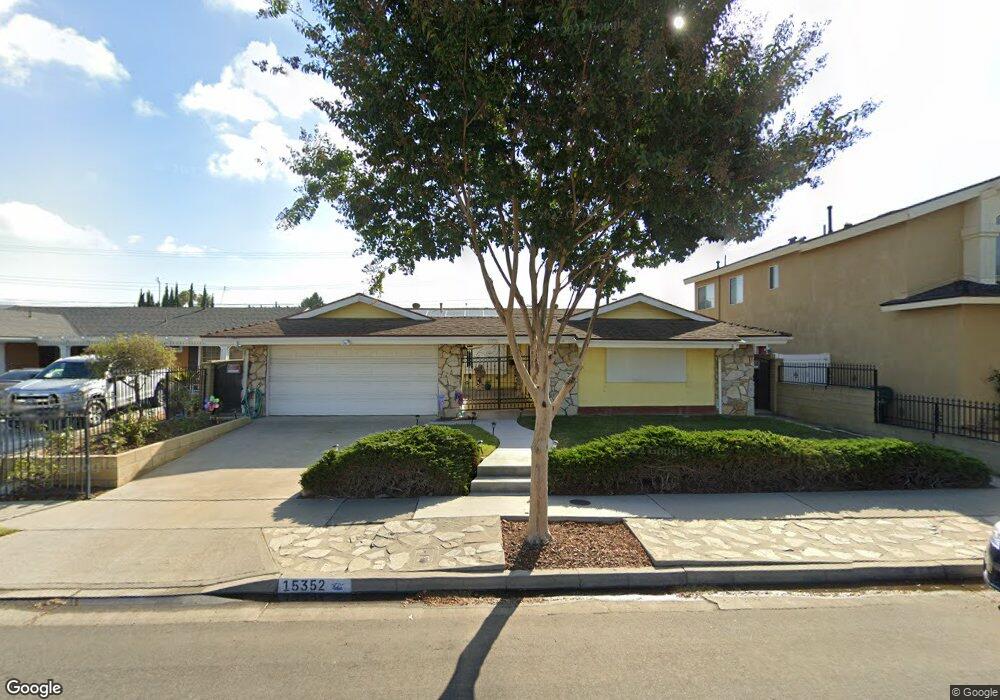
15352 Cambay Ln Huntington Beach, CA 92649
Estimated Value: $1,216,000 - $1,437,000
4
Beds
2
Baths
1,933
Sq Ft
$682/Sq Ft
Est. Value
About This Home
This home is located at 15352 Cambay Ln, Huntington Beach, CA 92649 and is currently estimated at $1,317,440, approximately $681 per square foot. 15352 Cambay Ln is a home located in Orange County with nearby schools including Village View Elementary School, Spring View Middle School, and Marina High School.
Ownership History
Date
Name
Owned For
Owner Type
Purchase Details
Closed on
Nov 17, 2001
Sold by
Hupf Kenneth J and Hupf Deborah A
Bought by
Hupf Kenneth J and Hupf Deborah A
Current Estimated Value
Purchase Details
Closed on
Nov 5, 1999
Sold by
Old Republic Exchange Facilitator
Bought by
Hupf Kenneth J and Hupf Deborah
Home Financials for this Owner
Home Financials are based on the most recent Mortgage that was taken out on this home.
Original Mortgage
$252,700
Interest Rate
7.68%
Purchase Details
Closed on
Oct 12, 1999
Sold by
Sang Li Tit and Sang Nga W W
Bought by
Old Republic Exchange Facilitator Co
Home Financials for this Owner
Home Financials are based on the most recent Mortgage that was taken out on this home.
Original Mortgage
$252,700
Interest Rate
7.68%
Create a Home Valuation Report for This Property
The Home Valuation Report is an in-depth analysis detailing your home's value as well as a comparison with similar homes in the area
Home Values in the Area
Average Home Value in this Area
Purchase History
| Date | Buyer | Sale Price | Title Company |
|---|---|---|---|
| Hupf Kenneth J | -- | -- | |
| Hupf Kenneth J | $320,000 | Old Republic Title Company | |
| Old Republic Exchange Facilitator Co | -- | Old Republic Title Company |
Source: Public Records
Mortgage History
| Date | Status | Borrower | Loan Amount |
|---|---|---|---|
| Previous Owner | Hupf Kenneth J | $252,700 | |
| Closed | Old Republic Exchange Facilitator Co | $0 |
Source: Public Records
Tax History Compared to Growth
Tax History
| Year | Tax Paid | Tax Assessment Tax Assessment Total Assessment is a certain percentage of the fair market value that is determined by local assessors to be the total taxable value of land and additions on the property. | Land | Improvement |
|---|---|---|---|---|
| 2025 | $5,931 | $523,072 | $392,369 | $130,703 |
| 2024 | $5,931 | $512,816 | $384,675 | $128,141 |
| 2023 | $5,795 | $502,761 | $377,132 | $125,629 |
| 2022 | $5,708 | $492,903 | $369,737 | $123,166 |
| 2021 | $5,603 | $483,239 | $362,488 | $120,751 |
| 2020 | $5,539 | $478,284 | $358,771 | $119,513 |
| 2019 | $5,443 | $468,906 | $351,736 | $117,170 |
| 2018 | $5,320 | $459,712 | $344,839 | $114,873 |
| 2017 | $5,235 | $450,699 | $338,078 | $112,621 |
| 2016 | $5,021 | $441,862 | $331,449 | $110,413 |
| 2015 | $4,944 | $435,225 | $326,470 | $108,755 |
| 2014 | $4,571 | $401,210 | $320,075 | $81,135 |
Source: Public Records
Map
Nearby Homes
- 5131 Skylark Dr
- 16052 Waikiki Ln
- 4951 Maui Cir
- 5751 Mangrum Dr
- 16102 Ballad Ln
- 6022 Larchwood Dr
- 16262 Honolulu Ln
- 14422 Birmingham Dr
- 14862 Sabre Ln
- 16444 Bolsa Chica St Unit 137
- 16444 Bolsa Chica St Unit 74
- 16444 Bolsa Chica St Unit 60
- 16444 Bolsa Chica St Unit 16
- 16444 Bolsa Chica St Unit 26
- 16444 Bolsa Chica St Unit 167
- 16444 Bolsa Chica St Unit 21
- 6101 Jade Cir
- 5056 Hampton Ct
- 15062 Baylor Cir
- 5591 Heil Ave
- 15346 Cambay Ln
- 15342 Cambay Ln
- 15362 Cambay Ln
- 15372 Cambay Ln
- 15332 Cambay Ln
- 15381 Chemical Ln
- 15351 Cambay Ln
- 15361 Cambay Ln
- 5202 Tasman Dr
- 15382 Cambay Ln
- 15371 Cambay Ln
- 15322 Cambay Ln
- 5192 Tasman Dr
- 15381 Cambay Ln
- 15392 Cambay Ln
- 15352 Baffin Cir
- 15362 Baffin Cir
- 15302 Cambay Ln
- 15391 Cambay Ln
- 15372 Baffin Cir