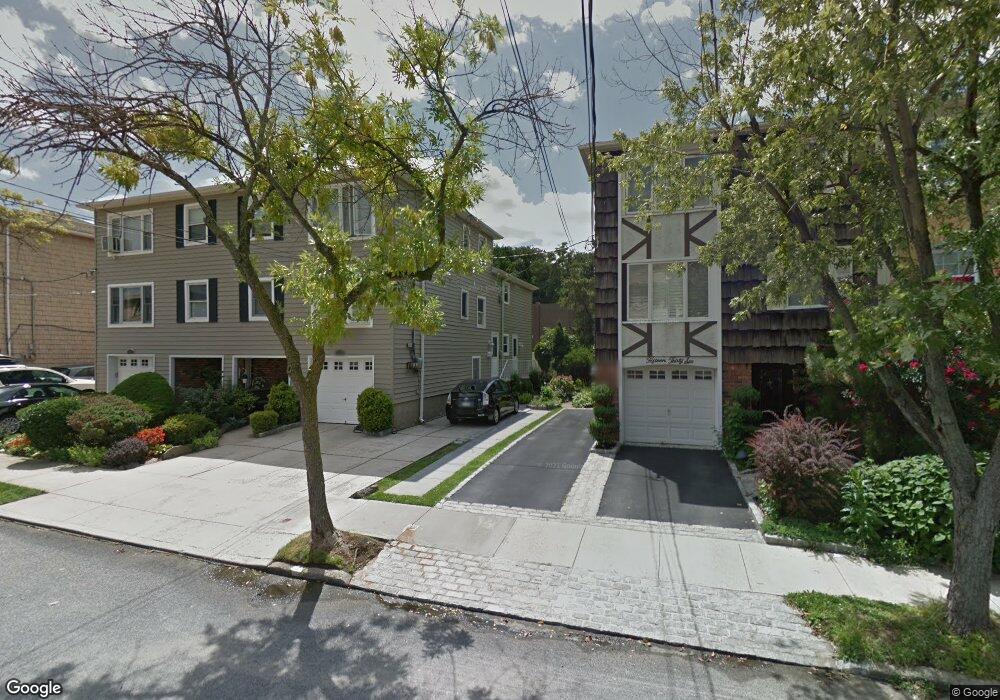
1536 208th St Bayside, NY 11360
Bayside NeighborhoodEstimated Value: $1,326,000 - $1,693,000
4
Beds
3
Baths
3,267
Sq Ft
$464/Sq Ft
Est. Value
About This Home
This home is located at 1536 208th St, Bayside, NY 11360 and is currently estimated at $1,514,951, approximately $463 per square foot. 1536 208th St is a home located in Queens County with nearby schools including P.S. 209 - Clearview Gardens, J.H.S. 194 William Carr, and Bayside High School.
Ownership History
Date
Name
Owned For
Owner Type
Purchase Details
Closed on
Apr 8, 2021
Sold by
Bayside Realty Holdings Inc
Bought by
Tan Rui Zhen and Zhao Ken
Current Estimated Value
Home Financials for this Owner
Home Financials are based on the most recent Mortgage that was taken out on this home.
Original Mortgage
$346,000
Outstanding Balance
$312,895
Interest Rate
3.1%
Mortgage Type
Purchase Money Mortgage
Estimated Equity
$1,202,056
Purchase Details
Closed on
Mar 30, 2021
Sold by
Anderson Nicholas
Bought by
Bayside Realty Holdings Inc
Home Financials for this Owner
Home Financials are based on the most recent Mortgage that was taken out on this home.
Original Mortgage
$346,000
Outstanding Balance
$312,895
Interest Rate
3.1%
Mortgage Type
Purchase Money Mortgage
Estimated Equity
$1,202,056
Purchase Details
Closed on
Mar 21, 2012
Sold by
Anderson Dina N
Bought by
Bayside Realty Holdings Inc
Create a Home Valuation Report for This Property
The Home Valuation Report is an in-depth analysis detailing your home's value as well as a comparison with similar homes in the area
Home Values in the Area
Average Home Value in this Area
Purchase History
| Date | Buyer | Sale Price | Title Company |
|---|---|---|---|
| Tan Rui Zhen | $1,282,000 | -- | |
| Bayside Realty Holdings Inc | -- | -- | |
| Bayside Realty Holdings Inc | -- | -- |
Source: Public Records
Mortgage History
| Date | Status | Borrower | Loan Amount |
|---|---|---|---|
| Open | Tan Rui Zhen | $346,000 |
Source: Public Records
Tax History Compared to Growth
Tax History
| Year | Tax Paid | Tax Assessment Tax Assessment Total Assessment is a certain percentage of the fair market value that is determined by local assessors to be the total taxable value of land and additions on the property. | Land | Improvement |
|---|---|---|---|---|
| 2025 | $14,991 | $79,118 | $11,448 | $67,670 |
| 2024 | $14,991 | $74,640 | $11,468 | $63,172 |
| 2023 | $14,143 | $70,416 | $11,313 | $59,103 |
| 2022 | $13,988 | $82,080 | $14,160 | $67,920 |
| 2021 | $14,708 | $86,520 | $14,160 | $72,360 |
| 2020 | $13,951 | $86,700 | $14,160 | $72,540 |
| 2019 | $13,012 | $86,400 | $14,160 | $72,240 |
| 2018 | $11,962 | $58,680 | $12,169 | $46,511 |
| 2017 | $11,903 | $58,392 | $12,392 | $46,000 |
| 2016 | $11,643 | $58,392 | $12,392 | $46,000 |
| 2015 | -- | $54,944 | $14,017 | $40,927 |
| 2014 | -- | $51,834 | $14,176 | $37,658 |
Source: Public Records
Map
Nearby Homes
- 208-18 15th Rd
- 210 E 15th St Unit 2N
- 210 E 15th St Unit PHD
- 210 E 15th St Unit 10E
- 210 E 15th St Unit 6A
- 210 E 15th St Unit 2H
- 210 E 15th St Unit 1A
- 210 E 15th St
- 210 E 15th St Unit 5G
- 210 E 15th St Unit 2M
- 210 E 15th St Unit 6K
- 20817 15th Rd
- 207-30 Jordan Dr Unit 97U
- 15-01 Jordan Ct Unit 104M
- 15-01 Jordan Ct Unit 104 U
- 14-04 Michael Place Unit 113 U
- 208-08 Estates Dr Unit 22125
- 1404 Bonnie Ln Unit 15803
- 13-25 Estates Ln Unit 3F
- 209-15 18th Ave Unit 2A
- 1536 208th St
- 1536 208th St
- 1534 208th St Unit 2 Fl
- 1534 208th St
- 15-36 208th St
- 1540 208th St
- 1530 208th St
- 1542 208th St
- 1528 208th St
- 1546 208th St
- 1546 208th St
- 15-48 208th St
- 1548 208th St
- 1526 208th St
- 1526 208th St Unit 2
- 15-26 208th St Unit 2
- 15-35 208th St
- 15-35 208th St Unit 2
- 1539 208th St Unit 2 Fl
- 1539 208th St