1536 Myrtle St Oakland, CA 94607
West Oakland NeighborhoodEstimated Value: $605,000 - $967,493
About This Home
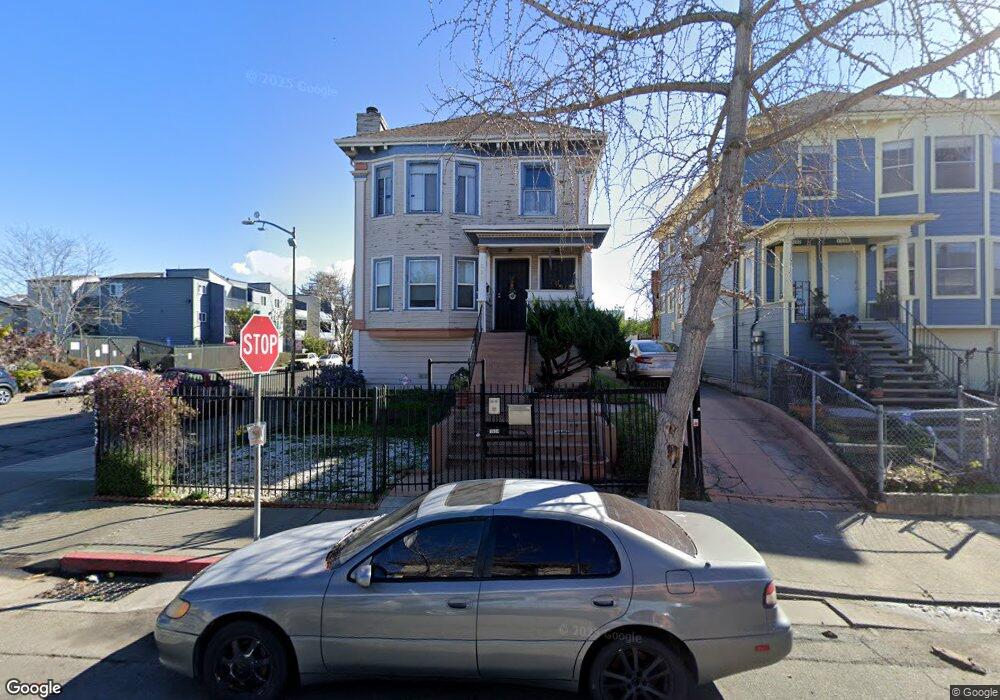
This home is located at 1536 Myrtle St, Oakland, CA 94607 and is currently estimated at $753,873, approximately $335 per square foot. 1536 Myrtle St is a home located in Alameda County with nearby schools including M. L. King Jr. Elementary School, West Oakland Middle School, and McClymonds High School.
Ownership History
We collect this data history from publicly available records. To have your information removed, we recommend requesting removal directly through your county’s website.
Purchase Details
Purchase Details
Home Financials for this Owner
Home Financials are based on the most recent Mortgage that was taken out on this home.Purchase Details
Home Financials for this Owner
Home Financials are based on the most recent Mortgage that was taken out on this home.Home Values in the Area
Average Home Value in this Area
Purchase History
We collect this data history from publicly available records. To have your information removed, we recommend requesting removal directly through your county’s website.
| Date | Buyer | Sale Price | Title Company |
|---|---|---|---|
| -- | None Listed On Document | ||
| -- | First American Title Company | ||
| -- | First American Title Company |
Mortgage History
We collect this data history from publicly available records. To have your information removed, we recommend requesting removal directly through your county’s website.
| Date | Status | Borrower | Loan Amount |
|---|---|---|---|
| Closed | $100,000 |
Tax History
We collect this data history from publicly available records. To have your information removed, we recommend requesting removal directly through your county’s website.
| Year | Tax Paid | Tax Assessment Tax Assessment Total Assessment is a certain percentage of the fair market value that is determined by local assessors to be the total taxable value of land and additions on the property. | Land | Improvement |
|---|---|---|---|---|
| 2025 | $5,165 | $227,564 | $75,061 | $159,503 |
| 2024 | $5,165 | $222,965 | $73,589 | $156,376 |
| 2023 | $5,284 | $225,457 | $72,147 | $153,310 |
| 2022 | $5,014 | $214,036 | $70,732 | $150,304 |
| 2021 | $4,605 | $209,702 | $69,345 | $147,357 |
| 2020 | $4,550 | $214,481 | $68,634 | $145,847 |
| 2019 | $4,258 | $210,276 | $67,289 | $142,987 |
| 2018 | $4,170 | $206,154 | $65,970 | $140,184 |
| 2017 | $3,962 | $202,112 | $64,676 | $137,436 |
| 2016 | $3,764 | $198,149 | $63,408 | $134,741 |
| 2015 | $3,739 | $195,173 | $62,456 | $132,717 |
| 2014 | $3,782 | $191,349 | $61,232 | $130,117 |
Map
- 1433 Myrtle St
- 1917 Myrtle St
- 1714 Chestnut St
- 1920 Linden St
- 1832 Chestnut St
- 1923 West St
- 881 21st St
- 1119 16th St
- 1486 Adeline St
- 1476 Adeline St
- 856 21st St
- 1810 Adeline St
- 1127 Linden St
- 150 Uptown Cir
- 117 Uptown Cir
- 850 W Grand Ave Unit 7
- 2309 Myrtle St
- 2229 Myrtle St
- 931 Edy Ln
- 874 Isabella St
Ask me questions while you tour the home.