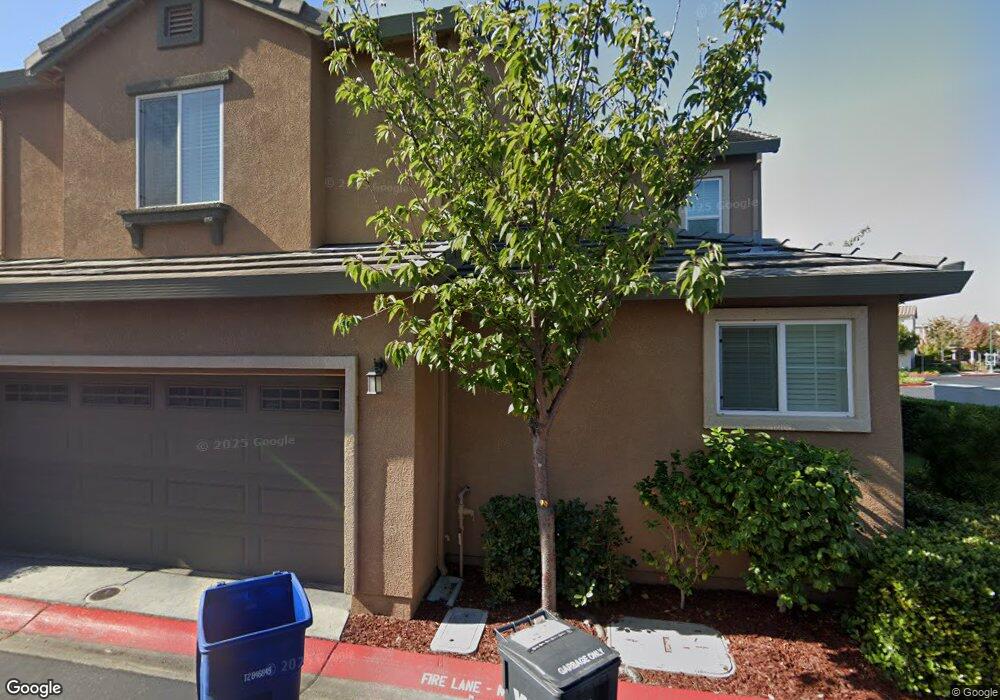
15369 Bay Port Ct San Leandro, CA 94579
Washington Manor-Bonaire NeighborhoodEstimated Value: $892,793 - $966,000
4
Beds
3
Baths
1,663
Sq Ft
$561/Sq Ft
Est. Value
About This Home
This home is located at 15369 Bay Port Ct, San Leandro, CA 94579 and is currently estimated at $932,698, approximately $560 per square foot. 15369 Bay Port Ct is a home located in Alameda County with nearby schools including Dayton Elementary School, Washington Manor Middle School, and Arroyo High School.
Ownership History
Date
Name
Owned For
Owner Type
Purchase Details
Closed on
Nov 8, 2019
Sold by
Valdez Alejandro C and Valdez Grace C
Bought by
Wu Cynthia and Wu Carol
Current Estimated Value
Purchase Details
Closed on
Aug 23, 2010
Sold by
Valdez Grace C and Valdez Alejandro C
Bought by
Valdez Alejandro C and Valdez Grace C
Home Financials for this Owner
Home Financials are based on the most recent Mortgage that was taken out on this home.
Original Mortgage
$492,240
Interest Rate
4.52%
Mortgage Type
FHA
Purchase Details
Closed on
Oct 17, 2008
Sold by
Diversified Developers Inc
Bought by
Valdez Grace C and Valdez Aleandro C
Home Financials for this Owner
Home Financials are based on the most recent Mortgage that was taken out on this home.
Original Mortgage
$491,624
Interest Rate
5.9%
Mortgage Type
FHA
Create a Home Valuation Report for This Property
The Home Valuation Report is an in-depth analysis detailing your home's value as well as a comparison with similar homes in the area
Home Values in the Area
Average Home Value in this Area
Purchase History
| Date | Buyer | Sale Price | Title Company |
|---|---|---|---|
| Wu Cynthia | $760,000 | Old Republic Title Company | |
| Valdez Alejandro C | -- | Westminster Title Company | |
| Valdez Grace C | $500,000 | Chicago Title Company |
Source: Public Records
Mortgage History
| Date | Status | Borrower | Loan Amount |
|---|---|---|---|
| Previous Owner | Valdez Alejandro C | $492,240 | |
| Previous Owner | Valdez Grace C | $491,624 |
Source: Public Records
Tax History Compared to Growth
Tax History
| Year | Tax Paid | Tax Assessment Tax Assessment Total Assessment is a certain percentage of the fair market value that is determined by local assessors to be the total taxable value of land and additions on the property. | Land | Improvement |
|---|---|---|---|---|
| 2025 | $10,241 | $831,158 | $249,347 | $581,811 |
| 2024 | $10,241 | $814,864 | $244,459 | $570,405 |
| 2023 | $10,181 | $798,888 | $239,666 | $559,222 |
| 2022 | $10,045 | $783,224 | $234,967 | $548,257 |
| 2021 | $9,775 | $767,873 | $230,362 | $537,511 |
| 2020 | $9,573 | $760,000 | $228,000 | $532,000 |
| 2019 | $7,512 | $576,948 | $173,084 | $403,864 |
| 2018 | $7,109 | $565,638 | $169,691 | $395,947 |
| 2017 | $6,778 | $554,547 | $166,364 | $388,183 |
| 2016 | $6,623 | $543,677 | $163,103 | $380,574 |
| 2015 | $6,479 | $535,514 | $160,654 | $374,860 |
| 2014 | $6,381 | $525,028 | $157,508 | $367,520 |
Source: Public Records
Map
Nearby Homes
- 15356 Sullivan Ave
- 874 Lewelling Blvd
- 15535 Sedgeman St
- 840 Woodgate Dr
- 747 Lewelling Blvd
- 747 Lewelling Blvd Unit SPC 22
- 720 Fargo Ave Unit 14
- 670 Fargo Ave Unit 5
- 700 Fargo Ave Unit 2
- 700 Fargo Ave Unit 12
- 15596 Tilden St
- 650 Fargo Ave Unit 4
- 619 Beatrice St
- 15049 Kesterson St
- 15009 Kesterson St
- 15001 Norton St Unit 1
- 15106 Edgemoor St
- 15512 Farnsworth St
- 15102 Chapel Ct
- 15822 Devonwood Way
- 15367 Bay Port Ct
- 15365 Bay Port Ct
- 15371 Bay Port Ct
- 15373 Bay Port Ct
- 915 Lewelling Blvd
- 941 Lewelling Blvd Unit 312
- 941 Lewelling Blvd Unit 304
- 941 Lewelling Blvd
- 15375 Bay Port Ct
- 908 Burkhart Ave
- 907 Burkhart Ave
- 916 Burkhart Ave
- 15432 Sedgeman St
- 915 Burkhart Ave
- 916 Lewelling Blvd
- 15450 Sedgeman St
- 15326 Sullivan Ave
- 15332 Sullivan Ave
- 15338 Sullivan Ave
- 15320 Sullivan Ave