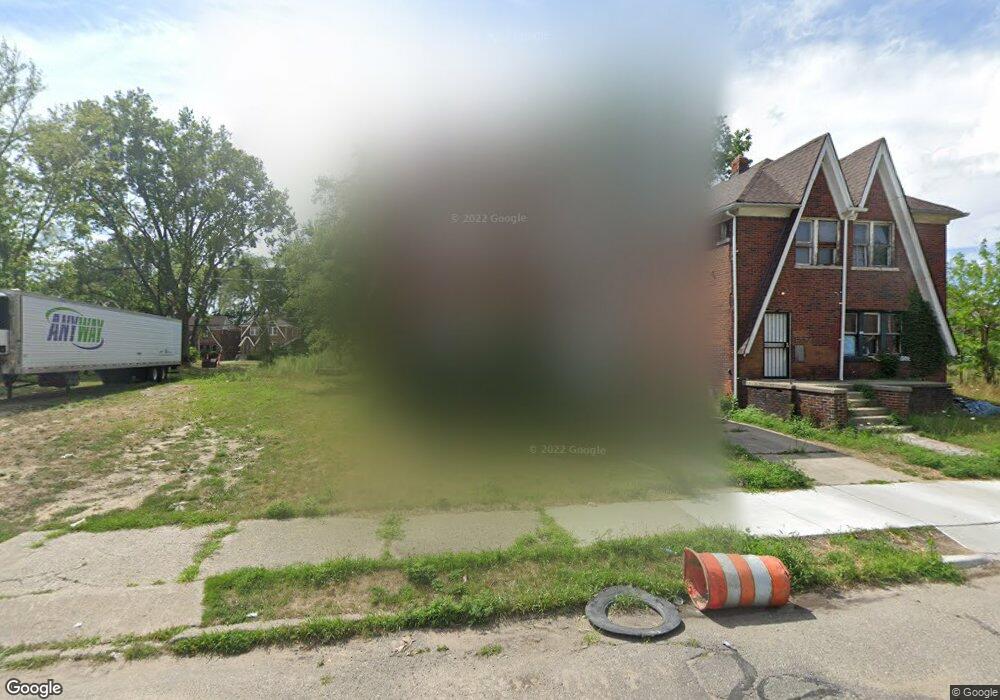
15369 Steel St Detroit, MI 48227
Bethune Community NeighborhoodEstimated Value: $69,000 - $148,000
4
Beds
3
Baths
2,125
Sq Ft
$50/Sq Ft
Est. Value
About This Home
This home is located at 15369 Steel St, Detroit, MI 48227 and is currently estimated at $106,000, approximately $49 per square foot. 15369 Steel St is a home located in Wayne County with nearby schools including Mary McLeod Bethune Elementary/Middle School, Charles L. Spain Elementary-Middle School, and Edward 'Duke' Ellington Conservatory of Music and Art.
Ownership History
Date
Name
Owned For
Owner Type
Purchase Details
Closed on
Dec 20, 2016
Sold by
Sabree Eric R
Bought by
Arrow Arkan
Current Estimated Value
Purchase Details
Closed on
May 18, 2015
Sold by
Benjigates Estates Llc
Bought by
Vok Dylan T
Purchase Details
Closed on
Nov 27, 2012
Sold by
Wayne County Treasurer
Bought by
Benjigates Estates Llc
Purchase Details
Closed on
Nov 29, 2011
Sold by
Ez Access Funding Llc
Bought by
Taylor Jennifer
Purchase Details
Closed on
Mar 19, 2009
Sold by
Secretary Of Housing & Urban Development
Bought by
Ez Access Funding Llc
Purchase Details
Closed on
Oct 26, 2006
Sold by
Washington Mutual Bank
Bought by
Hud
Purchase Details
Closed on
Apr 19, 2006
Sold by
Horride Derek S and Horride Derek
Bought by
Washington Mutual Bank
Purchase Details
Closed on
Mar 16, 2005
Sold by
Reed Mary Ann and Halliburton Mary Ann
Bought by
Horride Derek S
Create a Home Valuation Report for This Property
The Home Valuation Report is an in-depth analysis detailing your home's value as well as a comparison with similar homes in the area
Home Values in the Area
Average Home Value in this Area
Purchase History
| Date | Buyer | Sale Price | Title Company |
|---|---|---|---|
| Arrow Arkan | $500 | None Available | |
| Vok Dylan T | $1,000 | None Available | |
| Benjigates Estates Llc | $732 | None Available | |
| Taylor Jennifer | -- | None Available | |
| Ez Access Funding Llc | $2,000 | None Available | |
| Hud | -- | None Available | |
| Washington Mutual Bank | $89,899 | None Available | |
| Horride Derek S | $86,200 | Multiple |
Source: Public Records
Tax History Compared to Growth
Tax History
| Year | Tax Paid | Tax Assessment Tax Assessment Total Assessment is a certain percentage of the fair market value that is determined by local assessors to be the total taxable value of land and additions on the property. | Land | Improvement |
|---|---|---|---|---|
| 2025 | $38 | $1,400 | $0 | $0 |
| 2024 | $38 | $500 | $0 | $0 |
| 2023 | $38 | $500 | $0 | $0 |
| 2022 | $44 | $500 | $0 | $0 |
| 2021 | $44 | $500 | $0 | $0 |
| 2020 | $44 | $500 | $0 | $0 |
| 2019 | $44 | $500 | $0 | $0 |
| 2018 | $38 | $500 | $0 | $0 |
| 2017 | $9 | $500 | $0 | $0 |
| 2016 | $625 | $3,800 | $0 | $0 |
| 2015 | $380 | $3,800 | $0 | $0 |
| 2013 | -- | $21,331 | $0 | $0 |
| 2010 | -- | $30,562 | $773 | $29,789 |
Source: Public Records
Map
Nearby Homes
- 15361 Sorrento St
- 15355 Ward St
- 15325 Meyers Rd
- 15055 Steel St
- 15425 Sorrento St
- 15039 Sorrento St
- 15401 Meyers Rd
- 15428 Appoline St
- 15088 Littlefield St
- 15080 Littlefield St
- 14942 Ward Ave
- 15395 Littlefield St
- 14918 Appoline St
- 15731 Steel St
- 15032 Snowden St
- 14960 Littlefield St
- 14898 Appoline St
- 15725 Ward Ave
- 14885 Ward Ave
- 15495 Littlefield St
- 15373 Steel St
- 15363 Steel St
- 15379 Steel St
- 15359 Steel St
- 15383 Steel St
- 15355 Steel St
- 15366 Sorrento St
- 15376 Sorrento St
- 15364 Steel St
- 15382 Sorrento St
- 15362 Sorrento St
- 15372 Steel St
- 15388 Sorrento St
- 15345 Steel St
- 15358 Steel St
- 15352 Sorrento St
- 15356 Sorrento St
- 15382 Steel St
- 15354 Steel St
- 15341 Steel St