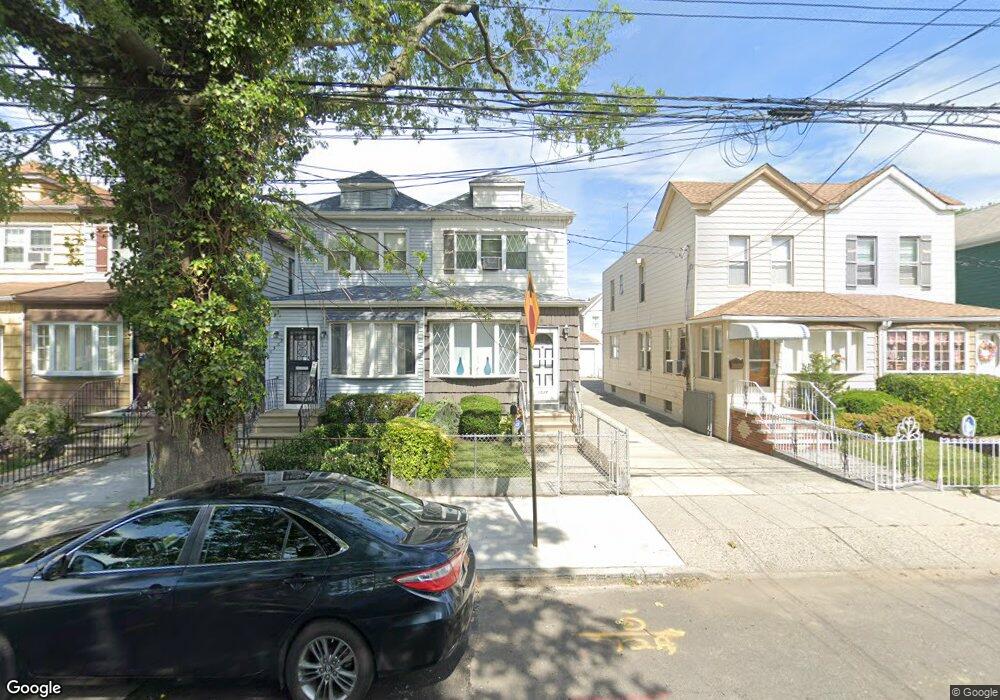
1537 E 53rd St Brooklyn, NY 11234
Flatlands NeighborhoodEstimated Value: $677,192 - $784,000
Studio
--
Bath
1,330
Sq Ft
$558/Sq Ft
Est. Value
About This Home
This home is located at 1537 E 53rd St, Brooklyn, NY 11234 and is currently estimated at $742,048, approximately $557 per square foot. 1537 E 53rd St is a home located in Kings County with nearby schools including P.S. 203 Floyd Bennett, Success Academy Charter School - Bergen Beach, and Midwood Catholic Academy.
Ownership History
Date
Name
Owned For
Owner Type
Purchase Details
Closed on
Jul 9, 2001
Sold by
Rhoden Wesley
Bought by
Rhoden Constance
Current Estimated Value
Purchase Details
Closed on
Aug 15, 1997
Sold by
Polimine Stephen
Bought by
Rhoden Wesley and Rhoden Constance
Home Financials for this Owner
Home Financials are based on the most recent Mortgage that was taken out on this home.
Original Mortgage
$166,250
Interest Rate
7.46%
Create a Home Valuation Report for This Property
The Home Valuation Report is an in-depth analysis detailing your home's value as well as a comparison with similar homes in the area
Home Values in the Area
Average Home Value in this Area
Purchase History
| Date | Buyer | Sale Price | Title Company |
|---|---|---|---|
| Rhoden Constance | -- | Reliable Title Agency | |
| Rhoden Constance | -- | Reliable Title Agency | |
| Rhoden Wesley | $175,000 | Commonwealth Land Title Ins | |
| Rhoden Wesley | $175,000 | Commonwealth Land Title Ins |
Source: Public Records
Mortgage History
| Date | Status | Borrower | Loan Amount |
|---|---|---|---|
| Previous Owner | Rhoden Wesley | $166,250 |
Source: Public Records
Tax History
| Year | Tax Paid | Tax Assessment Tax Assessment Total Assessment is a certain percentage of the fair market value that is determined by local assessors to be the total taxable value of land and additions on the property. | Land | Improvement |
|---|---|---|---|---|
| 2025 | $6,216 | $39,900 | $9,420 | $30,480 |
| 2024 | $6,216 | $42,720 | $9,420 | $33,300 |
| 2023 | $5,999 | $39,660 | $9,420 | $30,240 |
| 2022 | $5,692 | $34,260 | $9,420 | $24,840 |
| 2021 | $5,705 | $34,500 | $9,420 | $25,080 |
| 2019 | $5,399 | $32,580 | $9,420 | $23,160 |
| 2018 | $5,272 | $27,320 | $7,270 | $20,050 |
| 2017 | $5,105 | $26,512 | $8,477 | $18,035 |
| 2016 | $4,728 | $25,200 | $9,420 | $15,780 |
| 2015 | $2,797 | $25,500 | $10,500 | $15,000 |
| 2014 | $2,797 | $24,132 | $9,937 | $14,195 |
Source: Public Records
Map
Nearby Homes
Your Personal Tour Guide
Ask me questions while you tour the home.