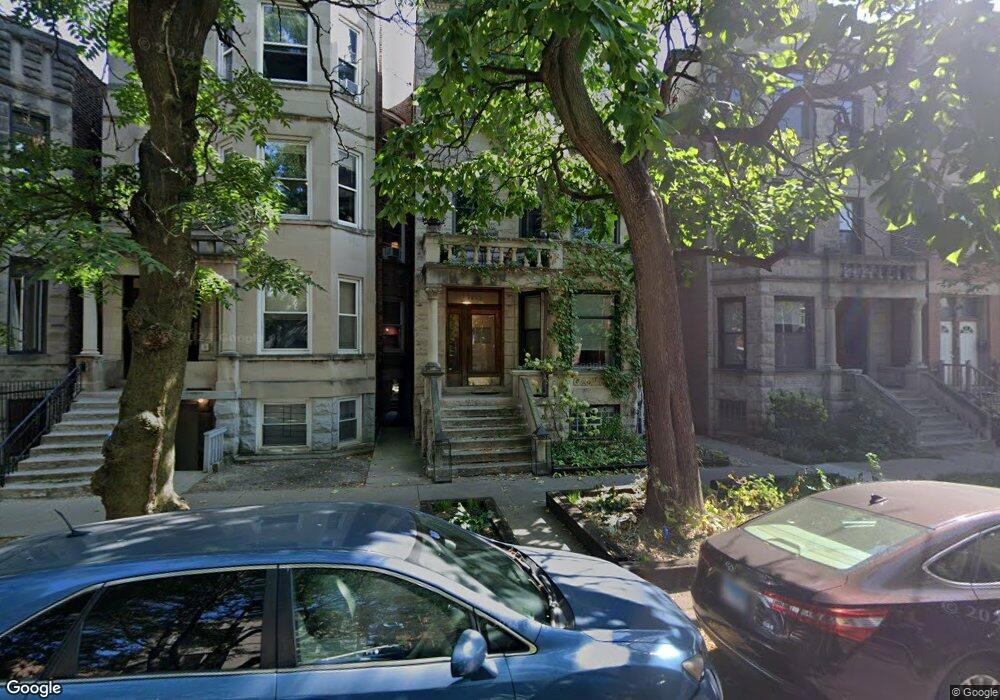
1537 N Claremont Ave Unit 3 Chicago, IL 60622
Wicker Park NeighborhoodEstimated Value: $508,000 - $684,000
3
Beds
2
Baths
1,300
Sq Ft
$436/Sq Ft
Est. Value
About This Home
This home is located at 1537 N Claremont Ave Unit 3, Chicago, IL 60622 and is currently estimated at $566,613, approximately $435 per square foot. 1537 N Claremont Ave Unit 3 is a home located in Cook County with nearby schools including José de Diego Community Academy, Clemente Community Academy High School, and Erie Elementary Charter School.
Ownership History
Date
Name
Owned For
Owner Type
Purchase Details
Closed on
Jul 21, 2015
Sold by
Jehlik Forrest
Bought by
Moon Kathryn Hall
Current Estimated Value
Home Financials for this Owner
Home Financials are based on the most recent Mortgage that was taken out on this home.
Original Mortgage
$96,250
Outstanding Balance
$75,725
Interest Rate
4.12%
Mortgage Type
New Conventional
Estimated Equity
$490,888
Purchase Details
Closed on
Nov 21, 2005
Sold by
Kelly Denis
Bought by
Jehlik Forrest
Home Financials for this Owner
Home Financials are based on the most recent Mortgage that was taken out on this home.
Original Mortgage
$292,000
Interest Rate
6.2%
Mortgage Type
Fannie Mae Freddie Mac
Create a Home Valuation Report for This Property
The Home Valuation Report is an in-depth analysis detailing your home's value as well as a comparison with similar homes in the area
Home Values in the Area
Average Home Value in this Area
Purchase History
| Date | Buyer | Sale Price | Title Company |
|---|---|---|---|
| Moon Kathryn Hall | $385,000 | Acquest Title Services Llc | |
| Jehlik Forrest | $365,000 | Rtc |
Source: Public Records
Mortgage History
| Date | Status | Borrower | Loan Amount |
|---|---|---|---|
| Open | Moon Kathryn Hall | $96,250 | |
| Previous Owner | Jehlik Forrest | $292,000 |
Source: Public Records
Tax History Compared to Growth
Tax History
| Year | Tax Paid | Tax Assessment Tax Assessment Total Assessment is a certain percentage of the fair market value that is determined by local assessors to be the total taxable value of land and additions on the property. | Land | Improvement |
|---|---|---|---|---|
| 2024 | $7,557 | $43,579 | $11,461 | $32,118 |
| 2023 | $7,323 | $39,027 | $5,241 | $33,786 |
| 2022 | $7,323 | $39,027 | $5,241 | $33,786 |
| 2021 | $7,178 | $39,025 | $5,240 | $33,785 |
| 2020 | $7,205 | $35,443 | $5,240 | $30,203 |
| 2019 | $7,046 | $38,499 | $5,240 | $33,259 |
| 2018 | $6,926 | $38,499 | $5,240 | $33,259 |
| 2017 | $8,122 | $41,106 | $4,607 | $36,499 |
| 2016 | $7,733 | $41,106 | $4,607 | $36,499 |
| 2015 | $7,052 | $41,106 | $4,607 | $36,499 |
| 2014 | $5,127 | $30,203 | $4,088 | $26,115 |
| 2013 | $5,015 | $30,203 | $4,088 | $26,115 |
Source: Public Records
Map
Nearby Homes
- 1540 N Claremont Ave Unit 1W
- 1619 N Artesian Ave
- 1623 N Artesian Ave
- 1533 N Campbell Ave Unit 3
- 1533 N Campbell Ave Unit 2
- 1526 N Leavitt St Unit 1
- 2315 W Wabansia Ave Unit 2W
- 1552 N Leavitt St Unit 1552
- 1456 N Campbell Ave
- 1719 N Western Ave Unit 4
- 1541 N Maplewood Ave
- 1446 N Campbell Ave
- 1355 N Western Ave Unit 2B
- 1355 N Western Ave Unit 4D
- 1355 N Western Ave Unit 2A
- 1355 N Western Ave Unit 3D
- 2150 W North Ave Unit 2
- 2257 W Hirsch St
- 2219 W Wabansia Ave Unit 3
- 1702 N Campbell Ave
- 1537 N Claremont Ave Unit 1
- 1537 N Claremont Ave Unit 2
- 1539 N Claremont Ave
- 1539 N Claremont Ave
- 1535 N Claremont Ave Unit 1
- 1535 N Claremont Ave
- 1543 N Claremont Ave Unit 1
- 1543 N Claremont Ave Unit ID1244945P
- 1543 N Claremont Ave Unit ID1244946P
- 1543 N Claremont Ave Unit ID1244947P
- 1533 N Claremont Ave Unit 1
- 1545 N Claremont Ave Unit L
- 1545 N Claremont Ave Unit 3
- 1545 N Claremont Ave Unit 1
- 1545 N Claremont Ave
- 1545 N Claremont Ave Unit 2
- 1529 N Claremont Ave Unit G
- 1529 N Claremont Ave Unit 1
- 1529 N Claremont Ave
- 1527 N Claremont Ave