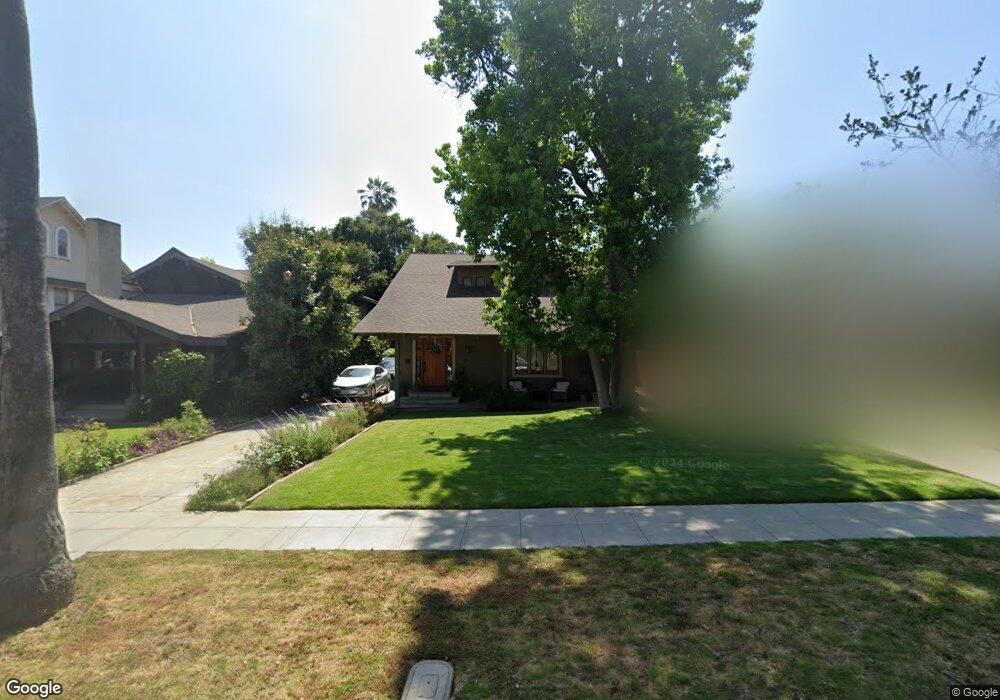
1537 Ramona Ave South Pasadena, CA 91030
Estimated Value: $2,287,400 - $2,886,000
5
Beds
3
Baths
2,864
Sq Ft
$897/Sq Ft
Est. Value
About This Home
This home is located at 1537 Ramona Ave, South Pasadena, CA 91030 and is currently estimated at $2,568,850, approximately $896 per square foot. 1537 Ramona Ave is a home located in Los Angeles County with nearby schools including Arroyo Vista Elementary, South Pasadena Middle School, and South Pasadena High School.
Ownership History
Date
Name
Owned For
Owner Type
Purchase Details
Closed on
Dec 18, 2014
Sold by
Primuth Karin Butler
Bought by
2006 Karin Butler Primuth and 2006 Jonathan Dav
Current Estimated Value
Purchase Details
Closed on
Nov 29, 2012
Sold by
Primuth Jonathan D
Bought by
Primuth Jonathan David and Primuth Karin Butler
Home Financials for this Owner
Home Financials are based on the most recent Mortgage that was taken out on this home.
Original Mortgage
$237,000
Outstanding Balance
$164,125
Interest Rate
3.36%
Mortgage Type
New Conventional
Estimated Equity
$2,404,725
Purchase Details
Closed on
Jan 21, 1998
Sold by
Schelling Susan I
Bought by
Primuth Jonathan D and Primuth Karin B
Home Financials for this Owner
Home Financials are based on the most recent Mortgage that was taken out on this home.
Original Mortgage
$301,600
Interest Rate
6.95%
Create a Home Valuation Report for This Property
The Home Valuation Report is an in-depth analysis detailing your home's value as well as a comparison with similar homes in the area
Home Values in the Area
Average Home Value in this Area
Purchase History
| Date | Buyer | Sale Price | Title Company |
|---|---|---|---|
| 2006 Karin Butler Primuth | -- | None Available | |
| Primuth Jonathan David | -- | Nations Title Company | |
| Primuth Jonathan D | $377,000 | Chicago Title Co |
Source: Public Records
Mortgage History
| Date | Status | Borrower | Loan Amount |
|---|---|---|---|
| Open | Primuth Jonathan David | $237,000 | |
| Closed | Primuth Jonathan D | $301,600 |
Source: Public Records
Tax History Compared to Growth
Tax History
| Year | Tax Paid | Tax Assessment Tax Assessment Total Assessment is a certain percentage of the fair market value that is determined by local assessors to be the total taxable value of land and additions on the property. | Land | Improvement |
|---|---|---|---|---|
| 2025 | $8,169 | $626,092 | $434,466 | $191,626 |
| 2024 | $8,169 | $613,817 | $425,948 | $187,869 |
| 2023 | $7,997 | $601,783 | $417,597 | $184,186 |
| 2022 | $7,812 | $589,984 | $409,409 | $180,575 |
| 2021 | $7,658 | $578,417 | $401,382 | $177,035 |
| 2019 | $7,431 | $561,263 | $389,478 | $171,785 |
| 2018 | $7,203 | $550,259 | $381,842 | $168,417 |
| 2016 | $6,666 | $528,893 | $367,015 | $161,878 |
| 2015 | $6,556 | $520,950 | $361,503 | $159,447 |
| 2014 | $6,473 | $510,746 | $354,422 | $156,324 |
Source: Public Records
Map
Nearby Homes
- 1416 Oak St
- 1810 Ramona Ave Unit 36
- 1424 Laurel St
- 868 Braewood Ct
- 838 Braewood Ct
- 1218 Pine St
- 1715 Fair Oaks Ave Unit 15
- 1130 Pine St
- 1257 Huntington Dr Unit A
- 1517 Huntington Dr
- 2131 Hascom
- 701 La Portada St
- 1712 Lyndon St
- 780 Monterey Rd
- 1020 El Centro St
- 1954 Primrose Ave
- 664 Monterey Rd
- 1202 Indiana Ave Unit 10
- 1104 Mission St
- 1529 Indiana Ave
- 1535 Ramona Ave
- 1541 Ramona Ave
- 1545 Ramona Ave
- 1531 Ramona Ave
- 1544 Diamond Ave
- 1538 Diamond Ave
- 1529 Ramona Ave
- 1222 Oak St
- 1546 Diamond Ave
- 1534 Diamond Ave
- 1550 Diamond Ave
- 1534 Ramona Ave
- 1534 Ramona Ave
- 1530 Diamond Ave
- 1525 Ramona Ave
- 1554 Diamond Ave
- 1526 Diamond Ave
- 1301 Oak St
- 1532 Ramona Ave
- 1528 Ramona Ave