1538 Parker St Berkeley, CA 94703
South Berkeley NeighborhoodEstimated Value: $956,317 - $1,127,000
2
Beds
1
Bath
1,001
Sq Ft
$1,013/Sq Ft
Est. Value
About This Home
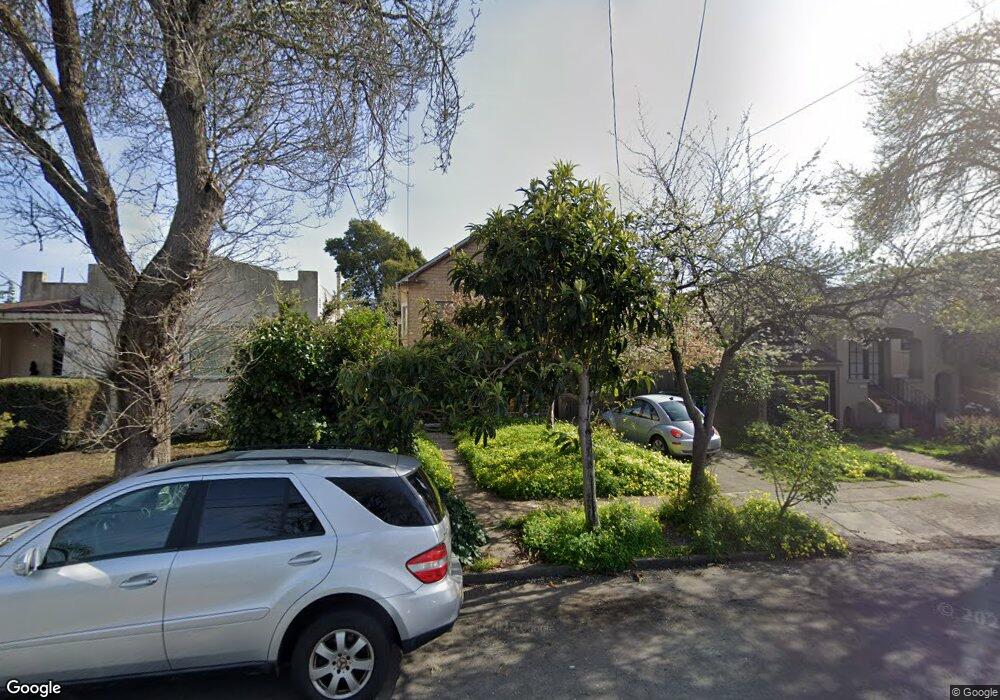
This home is located at 1538 Parker St, Berkeley, CA 94703 and is currently estimated at $1,013,829, approximately $1,012 per square foot. 1538 Parker St is a home located in Alameda County with nearby schools including Washington Elementary School, Malcolm X Elementary School, and Oxford Elementary School.
Ownership History
Date
Name
Owned For
Owner Type
Purchase Details
Closed on
Nov 17, 2020
Sold by
Omania Renate H and Omania Apolinar B
Bought by
Omania Apolinar B and Omania Renate H
Current Estimated Value
Home Financials for this Owner
Home Financials are based on the most recent Mortgage that was taken out on this home.
Original Mortgage
$406,200
Interest Rate
2.8%
Mortgage Type
New Conventional
Purchase Details
Closed on
Jun 13, 2013
Sold by
Omania Apolinar B and Omania Renate
Bought by
Omania Apolinar B and Omania Renate H
Purchase Details
Closed on
Jun 10, 2004
Sold by
Omania Jacouline Elbing
Bought by
Omania Apolinar B and Omania Renate
Create a Home Valuation Report for This Property
The Home Valuation Report is an in-depth analysis detailing your home's value as well as a comparison with similar homes in the area
Home Values in the Area
Average Home Value in this Area
Purchase History
| Date | Buyer | Sale Price | Title Company |
|---|---|---|---|
| Omania Apolinar B | -- | Chicago Title Company | |
| Omania Renate H | -- | Chicago Title Company | |
| Omania Apolinar B | -- | None Available | |
| Omania Apolinar B | -- | Chicago Title Company |
Source: Public Records
Mortgage History
| Date | Status | Borrower | Loan Amount |
|---|---|---|---|
| Closed | Omania Renate H | $406,200 |
Source: Public Records
Tax History
| Year | Tax Paid | Tax Assessment Tax Assessment Total Assessment is a certain percentage of the fair market value that is determined by local assessors to be the total taxable value of land and additions on the property. | Land | Improvement |
|---|---|---|---|---|
| 2025 | $7,850 | $365,918 | $109,775 | $256,143 |
| 2024 | $7,850 | $358,744 | $107,623 | $251,121 |
| 2023 | $7,606 | $351,711 | $105,513 | $246,198 |
| 2022 | $7,364 | $344,815 | $103,444 | $241,371 |
| 2021 | $7,353 | $338,055 | $101,416 | $236,639 |
| 2020 | $6,876 | $334,590 | $100,377 | $234,213 |
| 2019 | $6,509 | $328,030 | $98,409 | $229,621 |
| 2018 | $6,369 | $321,598 | $96,479 | $225,119 |
| 2017 | $6,125 | $315,294 | $94,588 | $220,706 |
| 2016 | $5,706 | $309,113 | $92,734 | $216,379 |
| 2015 | $5,932 | $304,470 | $91,341 | $213,129 |
| 2014 | $5,853 | $298,507 | $89,552 | $208,955 |
Source: Public Records
Map
Nearby Homes
- 1612 Carleton St
- 1515 Derby St
- 1612 Parker St
- 2750 Sacramento St
- 1634 Blake St
- 1450 Ward St
- 2758 Sacramento St
- 1604 Dwight Way
- 2774 Sacramento St
- 2782 Sacramento St
- 2790 Sacramento St
- 1645 Dwight Way
- 2829 California St
- 2701 Grant St
- 1535 Julia St
- 2717 Mabel St
- 2350 Sacramento St
- 1901 Parker St Unit 3
- 2922 Stanton St
- 2926 Ellis St
- 1536 Parker St
- 1542 Parker St
- 1534 Parker St
- 1548 Parker St
- 2608 California St
- 2610 California St
- 1532 Parker St
- 1537 Carleton St
- 1535 Carleton St
- 1533 Carleton St
- 2616 California St
- 1539 Carleton St
- 1529 Carleton St
- 1520 Parker St
- 1541 Parker St
- 2620 California St
- 1539 Parker St
- 1545 Parker St
- 1525 Carleton St
- 1535 Parker St
Your Personal Tour Guide
Ask me questions while you tour the home.