1538 Westview Dr Findlay, OH 45840
Estimated Value: $238,000
3
Beds
2
Baths
1,504
Sq Ft
$158/Sq Ft
Est. Value
About This Home
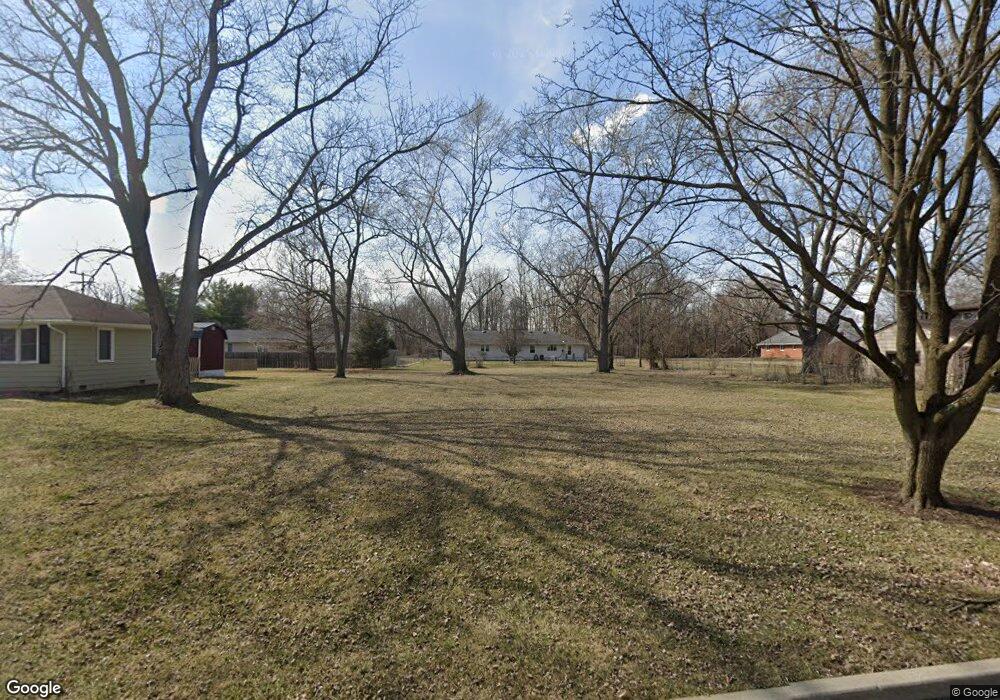
This home is located at 1538 Westview Dr, Findlay, OH 45840 and is currently priced at $238,000, approximately $158 per square foot. 1538 Westview Dr is a home located in Hancock County with nearby schools including Jefferson Elementary School, Chamberlin Hill Elementary School, and Donnell Middle School.
Ownership History
Date
Name
Owned For
Owner Type
Purchase Details
Closed on
Sep 14, 2017
Sold by
Steffan Jarrod L
Bought by
The Board Of Commissioners Of Hancock
Current Estimated Value
Purchase Details
Closed on
Apr 27, 2006
Sold by
Hradek Jitka
Bought by
Steffan Jarrod L
Home Financials for this Owner
Home Financials are based on the most recent Mortgage that was taken out on this home.
Original Mortgage
$100,000
Interest Rate
6.42%
Mortgage Type
Purchase Money Mortgage
Purchase Details
Closed on
Apr 11, 1994
Bought by
Baretta John D and Baretta Jessica L
Purchase Details
Closed on
Jan 16, 1992
Bought by
Wyzlic Martin L
Purchase Details
Closed on
Oct 20, 1987
Bought by
Wyzlic Martin L and Wyzlic Anna K
Purchase Details
Closed on
Jul 18, 1983
Bought by
Bolen Philip and Bolen Barbara
Create a Home Valuation Report for This Property
The Home Valuation Report is an in-depth analysis detailing your home's value as well as a comparison with similar homes in the area
Home Values in the Area
Average Home Value in this Area
Purchase History
| Date | Buyer | Sale Price | Title Company |
|---|---|---|---|
| The Board Of Commissioners Of Hancock | -- | None Available | |
| Steffan Jarrod L | $125,000 | None Available | |
| Baretta John D | $84,000 | -- | |
| Wyzlic Martin L | -- | -- | |
| Wyzlic Martin L | $64,900 | -- | |
| Bolen Philip | $48,000 | -- |
Source: Public Records
Mortgage History
| Date | Status | Borrower | Loan Amount |
|---|---|---|---|
| Previous Owner | Steffan Jarrod L | $100,000 |
Source: Public Records
Tax History Compared to Growth
Tax History
| Year | Tax Paid | Tax Assessment Tax Assessment Total Assessment is a certain percentage of the fair market value that is determined by local assessors to be the total taxable value of land and additions on the property. | Land | Improvement |
|---|---|---|---|---|
| 2024 | -- | $8,660 | $8,660 | $0 |
| 2023 | $0 | $8,660 | $8,660 | $0 |
| 2022 | $0 | $8,660 | $8,660 | $0 |
| 2021 | $0 | $8,660 | $8,660 | $0 |
| 2020 | $0 | $8,660 | $8,660 | $0 |
| 2019 | $0 | $8,660 | $8,660 | $0 |
| 2018 | $388 | $8,660 | $8,660 | $0 |
| 2017 | $1,531 | $34,290 | $8,660 | $25,630 |
| 2016 | $1,476 | $34,290 | $8,660 | $25,630 |
| 2015 | $1,191 | $27,240 | $8,660 | $18,580 |
| 2014 | $1,191 | $27,240 | $8,660 | $18,580 |
| 2012 | $1,425 | $32,310 | $8,660 | $23,650 |
Source: Public Records
Map
Nearby Homes
- 1709 Eastview Dr
- 1008 Eastview Dr
- 1726 Eastview Dr
- 804 6th St
- 1011 Stall Dr
- 1200 5th St
- 0 Blanchard Ave
- 1301 Fishlock Ave
- 1109 Brookside Dr
- 1727 Washington Ave
- 1802 Lippincott Ave
- 1037 Fishlock Ave
- 1109 Park St
- 904 Morse St
- 211 Fairlawn Place
- 820 Selby St
- 420 1st St
- 15591 Canadian Way
- 15586 Canadian Way
- 15615 Canadian Way
- 1600 Westview Dr
- 1526 Westview Dr
- 1539 Brookside Dr
- 1601 Brookside Dr
- 1614 Westview Dr
- 1539 Westview Dr
- 1527 Brookside Dr
- 1514 Westview Dr
- 1527 Westview Dr
- 1601 Westview Dr
- 1615 Brookside Dr
- 0 Brookside Dr Unit H115783
- 0 Brookside Dr Unit H115784
- 0 Brookside Dr
- 1515 Westview Dr
- 1626 Westview Dr
- 1615 Westview Dr
- 1515 Brookside Dr
- 1627 Brookside Dr
- 935 6th St