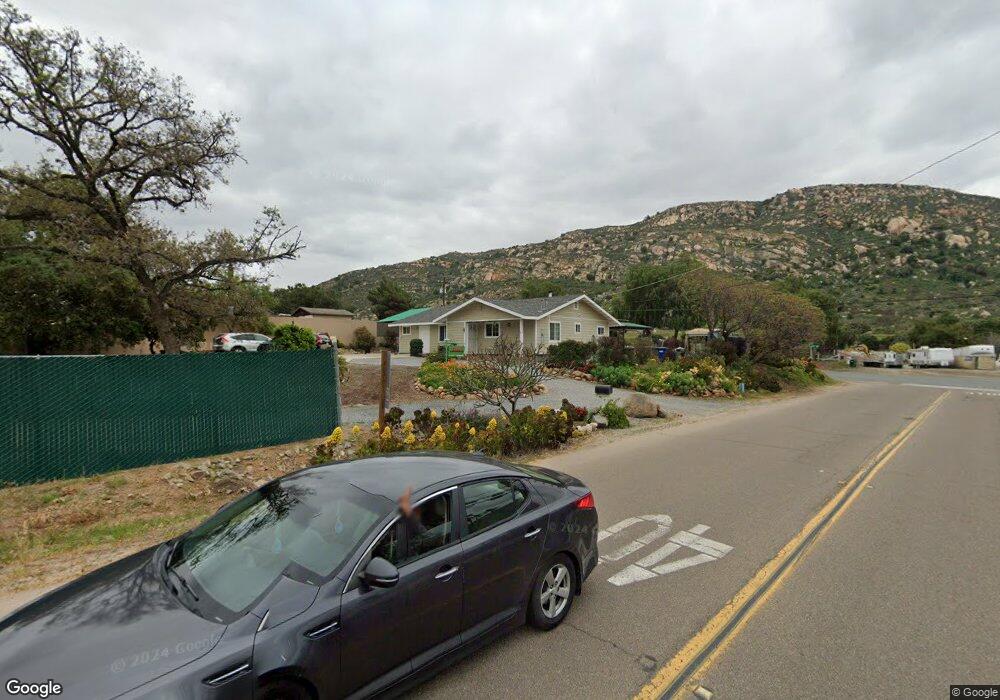
15380 Oak Creek Rd El Cajon, CA 92021
Blossom Valley NeighborhoodEstimated Value: $589,000 - $694,000
2
Beds
1
Bath
984
Sq Ft
$654/Sq Ft
Est. Value
About This Home
This home is located at 15380 Oak Creek Rd, El Cajon, CA 92021 and is currently estimated at $643,628, approximately $654 per square foot. 15380 Oak Creek Rd is a home located in San Diego County with nearby schools including Blossom Valley Elementary School, Los Coches Creek Middle School, and El Capitan High School.
Ownership History
Date
Name
Owned For
Owner Type
Purchase Details
Closed on
Aug 10, 2022
Sold by
Alfonso Martinez Jr and Alfonso Teresa
Bought by
Alfonso And Teresa Martinez Living Trust
Current Estimated Value
Purchase Details
Closed on
May 9, 2012
Sold by
Webb Donald E
Bought by
Webb Donald E
Purchase Details
Closed on
Nov 14, 2006
Sold by
Flocken Gerald F and Flocken Eleanore M
Bought by
Flocken Gerald F and Flocken Eleanore M
Purchase Details
Closed on
Oct 18, 2006
Sold by
Collins Thomas H
Bought by
Martinez Alfonso and Martinez Teresa
Purchase Details
Closed on
Dec 26, 2005
Sold by
Gardner Shirley I
Bought by
Gardner Shirley I and Morris Dennis M
Purchase Details
Closed on
Nov 19, 1993
Sold by
Wooters Samuel J and Wooters Celestia F
Bought by
Wooters Samuel Jasper and Wooters Celestia Fern
Purchase Details
Closed on
Dec 15, 1988
Create a Home Valuation Report for This Property
The Home Valuation Report is an in-depth analysis detailing your home's value as well as a comparison with similar homes in the area
Home Values in the Area
Average Home Value in this Area
Purchase History
| Date | Buyer | Sale Price | Title Company |
|---|---|---|---|
| Alfonso And Teresa Martinez Living Trust | -- | Oath Law | |
| Webb Donald E | -- | None Available | |
| Flocken Gerald F | -- | None Available | |
| Martinez Alfonso | $344,000 | Equity Title Co San Diego | |
| Gardner Shirley I | -- | None Available | |
| Wooters Samuel Jasper | -- | None Available | |
| -- | $105,000 | -- |
Source: Public Records
Tax History Compared to Growth
Tax History
| Year | Tax Paid | Tax Assessment Tax Assessment Total Assessment is a certain percentage of the fair market value that is determined by local assessors to be the total taxable value of land and additions on the property. | Land | Improvement |
|---|---|---|---|---|
| 2025 | $5,494 | $460,853 | $300,091 | $160,762 |
| 2024 | $5,494 | $451,817 | $294,207 | $157,610 |
| 2023 | $5,349 | $442,959 | $288,439 | $154,520 |
| 2022 | $5,261 | $434,275 | $282,784 | $151,491 |
| 2021 | $5,185 | $425,761 | $277,240 | $148,521 |
| 2020 | $4,750 | $390,000 | $246,000 | $144,000 |
| 2019 | $4,599 | $375,000 | $237,000 | $138,000 |
| 2018 | $4,325 | $350,000 | $222,000 | $128,000 |
| 2017 | $4,114 | $325,000 | $207,000 | $118,000 |
| 2016 | $3,488 | $280,000 | $179,000 | $101,000 |
| 2015 | $3,278 | $260,000 | $167,000 | $93,000 |
| 2014 | $2,670 | $210,000 | $135,000 | $75,000 |
Source: Public Records
Map
Nearby Homes
- 15420 Olde Highway 80 Unit SPC 44
- 15420 Olde Highway 80 Unit 218
- 15420 Olde Highway 80 Unit 12
- 15613 Hawley Ct
- 14930 Shanteau Dr Unit 57
- 15786 Olde Highway 80
- 5102 Espinoza Rd
- 15935 Spring Oaks Rd Unit 112
- 15935 Spring Oaks Rd Unit 38
- 15935 Spring Oaks Rd Unit 72
- 10328 Hawley Rd
- 9410 Brian Way
- 0 Quail Canyon Rd
- 9494 Chimney Rock Ln
- 10001 Dunbar Ln Unit 20
- 15068 Creek Hills Rd
- 15718 Creek Hills Rd
- 0 Rios Canyon Rd Unit PARCEL 1 250026753
- 0 Chocolate Creek Rd
- 9824 Quail Canyon Rd
- 15386 Olde Highway 80
- 15353 Olde Highway 80
- 15420 Olde Highway 80 Rd(325)street Tpe Post Dir
- 15420 Olde Highway 80 Sp 133
- 15417 Olde Highway 80
- 15405 Olde Highway 80
- 15284 Olde Highway 80
- 15430-36 Highway 8 Business
- 15409 Olde Highway 80
- 9641 Snow View Dr
- 15274 Olde Highway 80
- 15420 Olde Hwy 80 Unit 190
- 15420 Olde Hwy 80 Unit 129
- 15420 Olde Hwy 80 Unit 10
- 15420 Olde Hwy 80 Unit 239
- 15420 Olde Hwy 80 Unit 33
- 15420 Olde Hwy 80 Unit 130
- 15420 Olde Hwy 80 Unit 189
- 15420 Olde Hwy 80 Unit 158
- 15420 Olde Hwy 80 Unit 90