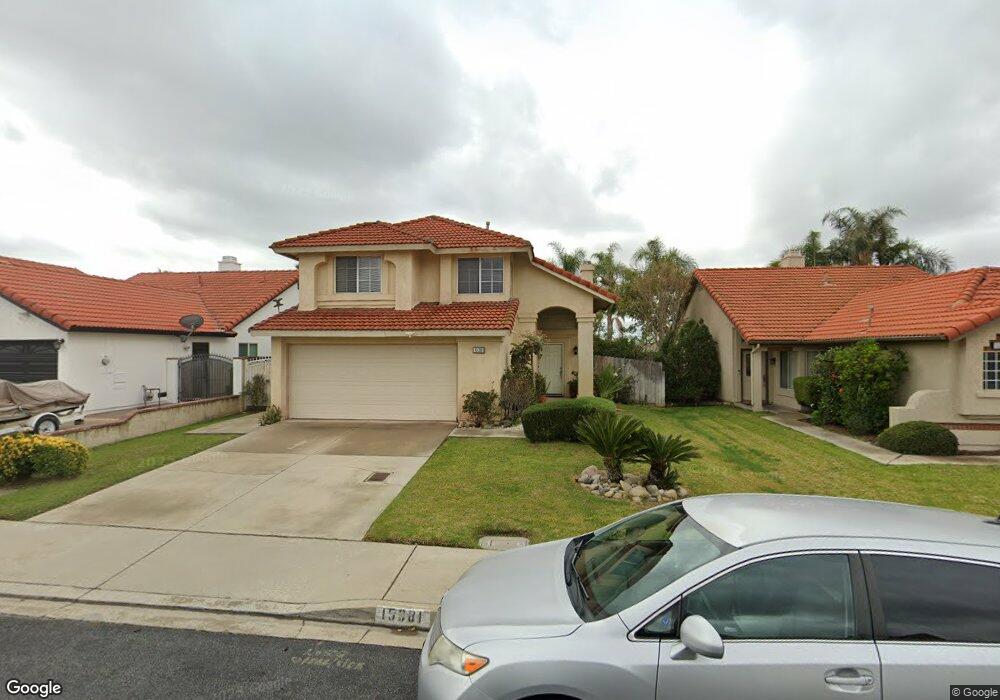
15381 Lantern Ln Fontana, CA 92336
Rancho Fontana NeighborhoodEstimated Value: $585,505 - $649,000
3
Beds
3
Baths
1,468
Sq Ft
$427/Sq Ft
Est. Value
About This Home
This home is located at 15381 Lantern Ln, Fontana, CA 92336 and is currently estimated at $627,376, approximately $427 per square foot. 15381 Lantern Ln is a home located in San Bernardino County with nearby schools including Hemlock Elementary School, Almeria Middle School, and Summit High School.
Ownership History
Date
Name
Owned For
Owner Type
Purchase Details
Closed on
Jan 13, 2011
Sold by
Cross Paul
Bought by
Gealogo Nicomedes C and Gealogo Wanda P
Current Estimated Value
Home Financials for this Owner
Home Financials are based on the most recent Mortgage that was taken out on this home.
Original Mortgage
$224,169
Interest Rate
4.75%
Mortgage Type
FHA
Purchase Details
Closed on
Jan 27, 2004
Sold by
Gaul William H
Bought by
Cross Paul and Cross Youngae
Home Financials for this Owner
Home Financials are based on the most recent Mortgage that was taken out on this home.
Original Mortgage
$204,000
Interest Rate
4.25%
Mortgage Type
New Conventional
Purchase Details
Closed on
Dec 15, 2000
Sold by
U S Home Corp
Bought by
Thomas Sheelamma
Purchase Details
Closed on
Jun 7, 2000
Sold by
Dancel Lyndon D
Bought by
Gaul William H and Gaul Paula
Home Financials for this Owner
Home Financials are based on the most recent Mortgage that was taken out on this home.
Original Mortgage
$138,855
Interest Rate
8.63%
Mortgage Type
FHA
Create a Home Valuation Report for This Property
The Home Valuation Report is an in-depth analysis detailing your home's value as well as a comparison with similar homes in the area
Home Values in the Area
Average Home Value in this Area
Purchase History
| Date | Buyer | Sale Price | Title Company |
|---|---|---|---|
| Gealogo Nicomedes C | $230,000 | Westminster Title Company | |
| Cross Paul | $255,000 | First American | |
| Thomas Sheelamma | -- | Stewart Title | |
| Gaul William H | $140,000 | First American Title Ins Co |
Source: Public Records
Mortgage History
| Date | Status | Borrower | Loan Amount |
|---|---|---|---|
| Previous Owner | Gealogo Nicomedes C | $224,169 | |
| Previous Owner | Cross Paul | $204,000 | |
| Previous Owner | Gaul William H | $138,855 | |
| Closed | Gaul William H | $7,000 | |
| Closed | Cross Paul | $25,500 |
Source: Public Records
Tax History
| Year | Tax Paid | Tax Assessment Tax Assessment Total Assessment is a certain percentage of the fair market value that is determined by local assessors to be the total taxable value of land and additions on the property. | Land | Improvement |
|---|---|---|---|---|
| 2025 | $4,224 | $294,672 | $73,670 | $221,002 |
| 2024 | $3,945 | $288,894 | $72,225 | $216,669 |
| 2023 | $3,487 | $283,230 | $70,809 | $212,421 |
| 2022 | $3,456 | $277,677 | $69,421 | $208,256 |
| 2021 | $3,410 | $272,233 | $68,060 | $204,173 |
| 2020 | $3,388 | $269,441 | $67,362 | $202,079 |
| 2019 | $3,300 | $264,158 | $66,041 | $198,117 |
| 2018 | $3,322 | $258,978 | $64,746 | $194,232 |
| 2017 | $3,279 | $253,900 | $63,476 | $190,424 |
| 2016 | $3,205 | $248,921 | $62,231 | $186,690 |
| 2015 | $3,149 | $245,182 | $61,296 | $183,886 |
| 2014 | $3,136 | $240,379 | $60,095 | $180,284 |
Source: Public Records
Map
Nearby Homes
- 15359 Palm Leaf Ln
- 15578 Westfork Ln Unit 1 & 2
- 7434 Freeport Cir
- 7526 Purple Sage Cir
- 7786 Arosia Dr
- 15681 San Jacinto Ave
- 15457 Red Pepper Place
- 15691 Montgomery Dr
- 7230 Myrtle Place
- 15507 Vanilla Bean Ln
- 7219 Birch Tree Place
- 15581 Curry Place
- 7982 Sea Salt Ave
- 7232 Riley Dr
- 15609 Paprika Ln
- 7620 Catawba Ct
- 15783 Barbee St Unit 10
- 14987 Pepperdine Dr
- 15593 Faith St
- 7132 Niagara Dr
- 15373 Lantern Ln
- 15389 Lantern Ln
- 7601 Viola Ct
- 15365 Lantern Ln
- 15397 Lantern Ln
- 7602 Viola Ct
- 7607 Viola Ct
- 15357 Lantern Ln
- 15380 Lantern Ln
- 15388 Lantern Ln
- 15372 Lantern Ln
- 15396 Lantern Ln
- 7613 Viola Ct
- 15364 Lantern Ln
- 7608 Viola Ct
- 15349 Lantern Ln
- 7555 Sultana Ave
- 15356 Lantern Ln
- 7614 Viola Ct
- 7536 Sultana Ave
Your Personal Tour Guide
Ask me questions while you tour the home.