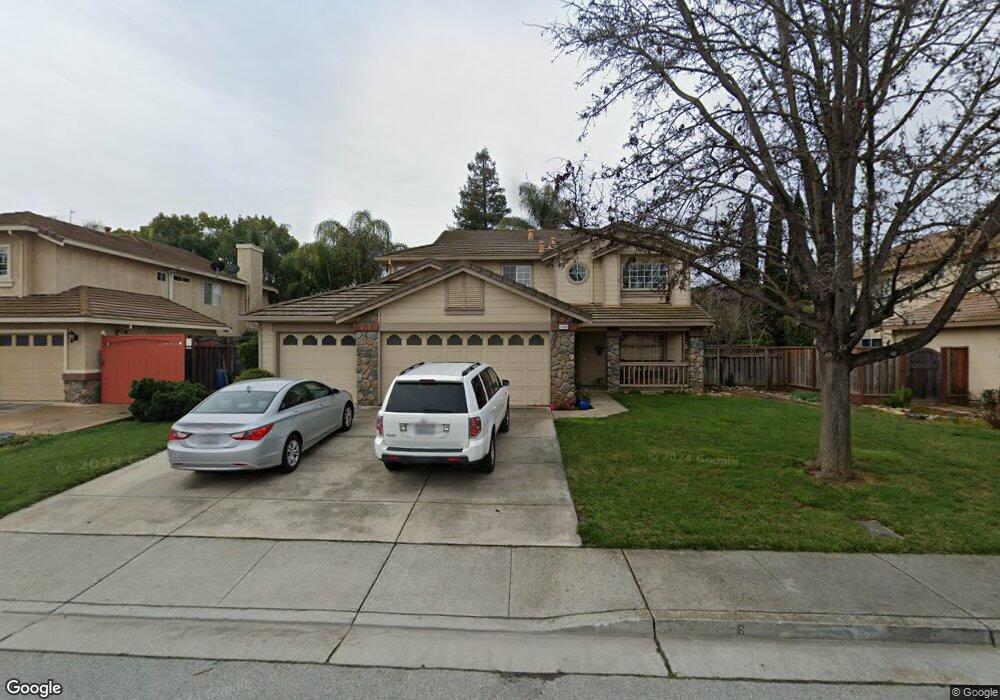
15385 La Arboleda Way Morgan Hill, CA 95037
Estimated Value: $1,389,735 - $1,566,000
4
Beds
3
Baths
2,237
Sq Ft
$664/Sq Ft
Est. Value
About This Home
This home is located at 15385 La Arboleda Way, Morgan Hill, CA 95037 and is currently estimated at $1,484,434, approximately $663 per square foot. 15385 La Arboleda Way is a home located in Santa Clara County with nearby schools including Paradise Valley Elementary, Britton Middle School, and Ann Sobrato High School.
Ownership History
Date
Name
Owned For
Owner Type
Purchase Details
Closed on
Oct 22, 2009
Sold by
Leininger Margaret A
Bought by
Leininger Margaret A
Current Estimated Value
Home Financials for this Owner
Home Financials are based on the most recent Mortgage that was taken out on this home.
Original Mortgage
$394,000
Outstanding Balance
$256,223
Interest Rate
5%
Mortgage Type
New Conventional
Estimated Equity
$1,228,211
Purchase Details
Closed on
Jun 9, 2005
Sold by
Leininger Daniel A
Bought by
Leininger Margaret A
Purchase Details
Closed on
Dec 14, 1995
Sold by
Trident Associates Ltd
Bought by
Leininger Daniel A and Leininger Margaret A
Home Financials for this Owner
Home Financials are based on the most recent Mortgage that was taken out on this home.
Original Mortgage
$243,950
Interest Rate
7.25%
Create a Home Valuation Report for This Property
The Home Valuation Report is an in-depth analysis detailing your home's value as well as a comparison with similar homes in the area
Home Values in the Area
Average Home Value in this Area
Purchase History
| Date | Buyer | Sale Price | Title Company |
|---|---|---|---|
| Leininger Margaret A | -- | Chicago Title Company | |
| Leininger Margaret A | -- | Chicago Title Co | |
| Leininger Daniel A | $305,000 | Santa Clara Land Title Co |
Source: Public Records
Mortgage History
| Date | Status | Borrower | Loan Amount |
|---|---|---|---|
| Open | Leininger Margaret A | $394,000 | |
| Previous Owner | Leininger Daniel A | $243,950 | |
| Closed | Leininger Daniel A | $30,500 |
Source: Public Records
Tax History Compared to Growth
Tax History
| Year | Tax Paid | Tax Assessment Tax Assessment Total Assessment is a certain percentage of the fair market value that is determined by local assessors to be the total taxable value of land and additions on the property. | Land | Improvement |
|---|---|---|---|---|
| 2025 | $6,358 | $539,151 | $207,645 | $331,506 |
| 2024 | $6,358 | $528,580 | $203,574 | $325,006 |
| 2023 | $6,278 | $518,217 | $199,583 | $318,634 |
| 2022 | $6,176 | $508,057 | $195,670 | $312,387 |
| 2021 | $6,027 | $498,096 | $191,834 | $306,262 |
| 2020 | $5,889 | $492,989 | $189,867 | $303,122 |
| 2019 | $5,946 | $483,324 | $186,145 | $297,179 |
| 2018 | $5,961 | $473,848 | $182,496 | $291,352 |
| 2017 | $5,906 | $464,558 | $178,918 | $285,640 |
| 2016 | $5,540 | $455,450 | $175,410 | $280,040 |
| 2015 | $5,482 | $448,610 | $172,776 | $275,834 |
| 2014 | $5,547 | $439,823 | $169,392 | $270,431 |
Source: Public Records
Map
Nearby Homes
- 605 Encino Dr
- 542 Via Sorrento
- 15180 Venetian Way
- 140 La Crosse Dr
- 15120 Venetian Way
- 15145 Bellini Way
- 136 Vinewood Ln Unit 136
- 14668 Excaliber Ct
- 199 Leisure Dr Unit 199
- 97 Melody Ln Unit 97
- 92 Melody Ln Unit 92
- 56 Creekside Dr Unit 56
- 42 Dewey Cir
- 407 Scotts Bluff Place
- 1020 Brookview Ct
- 0 Seymour Ave Unit 225017465
- 15223 Perry Ln
- 14430 Monterey Hwy
- 15209 Sycamore Dr
- 14325 Monterey Rd
- 15395 La Arboleda Way
- 15375 La Arboleda Way
- 15370 Calle Enrique
- 15380 Calle Enrique
- 15405 La Arboleda Way
- 15360 Calle Enrique
- 15365 La Arboleda Way
- 15380 La Arboleda Way
- 15390 La Arboleda Way
- 15370 La Arboleda Way
- 15390 Calle Enrique
- 15359 Via de Ninos
- 15400 La Arboleda Way
- 15350 Calle Enrique
- 15415 La Arboleda Way
- 15355 La Arboleda Way
- 15400 Calle Enrique
- 15410 La Arboleda Way
- 15367 Via de Ninos
- 15363 Via de Ninos