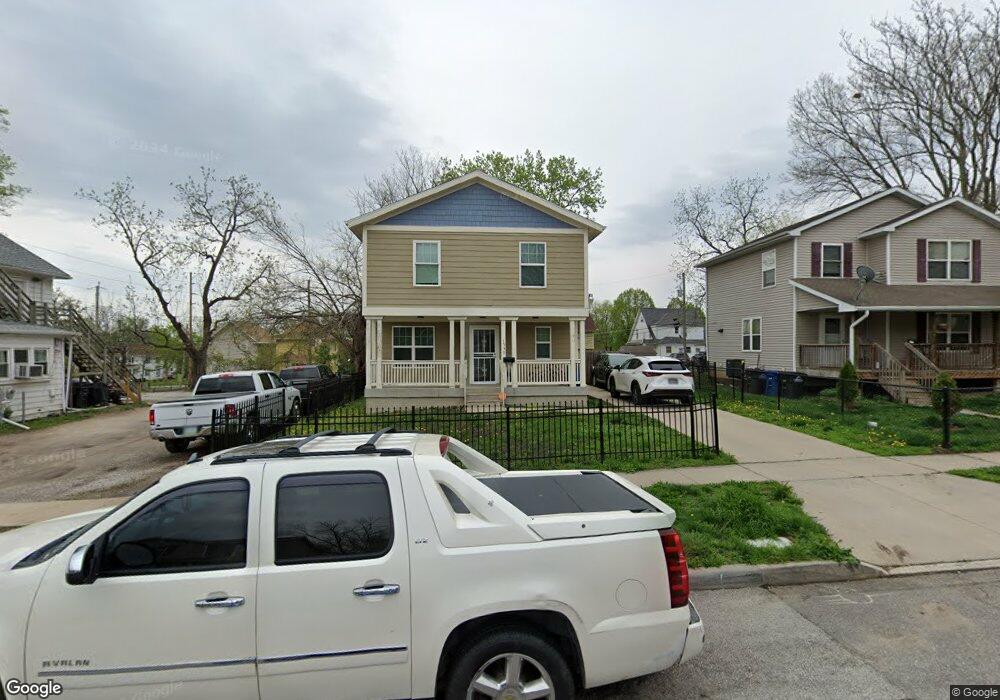
1539 10th St Des Moines, IA 50314
River Bend NeighborhoodEstimated Value: $162,000 - $246,000
4
Beds
2
Baths
1,368
Sq Ft
$145/Sq Ft
Est. Value
About This Home
This home is located at 1539 10th St, Des Moines, IA 50314 and is currently estimated at $198,686, approximately $145 per square foot. 1539 10th St is a home with nearby schools including Moulton Elementary School, Harding Middle School, and North High School.
Ownership History
Date
Name
Owned For
Owner Type
Purchase Details
Closed on
Feb 4, 2019
Sold by
Abdi Hussein
Bought by
Mursal Maryan
Current Estimated Value
Purchase Details
Closed on
Oct 3, 2012
Sold by
Greater Des Moinss Habitat For Humanity
Bought by
Mursal Maryan and Abdi Hussein
Home Financials for this Owner
Home Financials are based on the most recent Mortgage that was taken out on this home.
Original Mortgage
$102,570
Interest Rate
3.66%
Mortgage Type
Purchase Money Mortgage
Purchase Details
Closed on
Jun 10, 2009
Sold by
Kauten Michael J and Kelly James M
Bought by
Greater Des Moines Habitat For Humanity
Create a Home Valuation Report for This Property
The Home Valuation Report is an in-depth analysis detailing your home's value as well as a comparison with similar homes in the area
Home Values in the Area
Average Home Value in this Area
Purchase History
| Date | Buyer | Sale Price | Title Company |
|---|---|---|---|
| Mursal Maryan | -- | None Available | |
| Mursal Maryan | $119,000 | None Available | |
| Greater Des Moines Habitat For Humanity | -- | None Available |
Source: Public Records
Mortgage History
| Date | Status | Borrower | Loan Amount |
|---|---|---|---|
| Previous Owner | Mursal Maryan | $102,570 |
Source: Public Records
Tax History Compared to Growth
Tax History
| Year | Tax Paid | Tax Assessment Tax Assessment Total Assessment is a certain percentage of the fair market value that is determined by local assessors to be the total taxable value of land and additions on the property. | Land | Improvement |
|---|---|---|---|---|
| 2025 | $2,978 | $174,400 | $13,700 | $160,700 |
| 2024 | $2,978 | $151,400 | $11,700 | $139,700 |
| 2023 | $846 | $151,400 | $11,700 | $139,700 |
| 2022 | $840 | $145,400 | $8,900 | $136,500 |
| 2021 | $490 | $145,400 | $8,900 | $136,500 |
| 2020 | $508 | $129,100 | $7,900 | $121,200 |
| 2019 | $234 | $129,100 | $7,900 | $121,200 |
| 2018 | $232 | $118,200 | $7,000 | $111,200 |
| 2017 | $242 | $118,200 | $7,000 | $111,200 |
| 2016 | $236 | $118,400 | $7,000 | $111,400 |
| 2015 | $236 | $118,400 | $7,000 | $111,400 |
| 2014 | $148 | $107,600 | $7,000 | $100,600 |
Source: Public Records
Map
Nearby Homes