1539 120th St Hazleton, IA 50641
Estimated Value: $258,000 - $388,000
6
Beds
1
Bath
2,492
Sq Ft
$130/Sq Ft
Est. Value
About This Home
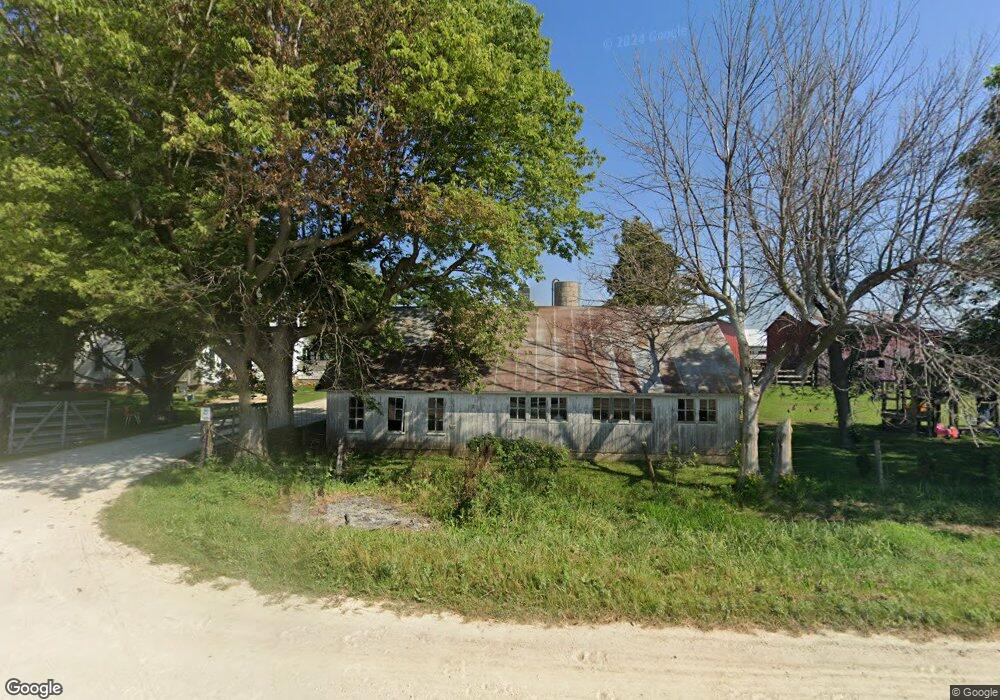
This home is located at 1539 120th St, Hazleton, IA 50641 and is currently estimated at $324,793, approximately $130 per square foot. 1539 120th St is a home located in Buchanan County.
Ownership History
Date
Name
Owned For
Owner Type
Purchase Details
Closed on
Dec 11, 2020
Sold by
Helmuth Freeman J and Helmuth Mary
Bought by
Helmuth Perry F and Helmuth Edna W
Current Estimated Value
Purchase Details
Closed on
Oct 23, 2015
Sold by
Hershberger Noah and Hershberger Susie
Bought by
Helmuth David
Create a Home Valuation Report for This Property
The Home Valuation Report is an in-depth analysis detailing your home's value as well as a comparison with similar homes in the area
Home Values in the Area
Average Home Value in this Area
Purchase History
| Date | Buyer | Sale Price | Title Company |
|---|---|---|---|
| Helmuth Perry F | $280,000 | None Available | |
| Helmuth David | $110,000 | None Available |
Source: Public Records
Tax History Compared to Growth
Tax History
| Year | Tax Paid | Tax Assessment Tax Assessment Total Assessment is a certain percentage of the fair market value that is determined by local assessors to be the total taxable value of land and additions on the property. | Land | Improvement |
|---|---|---|---|---|
| 2025 | $2,596 | $203,630 | $77,200 | $126,430 |
| 2024 | $2,596 | $176,160 | $62,670 | $113,490 |
| 2023 | $2,486 | $176,160 | $62,670 | $113,490 |
| 2022 | $2,376 | $145,020 | $48,850 | $96,170 |
| 2021 | $2,362 | $145,020 | $48,850 | $96,170 |
| 2020 | $2,362 | $133,000 | $45,340 | $87,660 |
| 2019 | $2,324 | $133,000 | $45,340 | $87,660 |
| 2018 | $2,170 | $154,660 | $67,240 | $87,420 |
| 2017 | $2,084 | $154,660 | $67,240 | $87,420 |
| 2016 | $1,974 | $158,615 | $75,060 | $83,555 |
| 2015 | $1,974 | $158,615 | $75,060 | $83,555 |
| 2014 | $2,094 | $169,198 | $82,550 | $86,648 |
Source: Public Records
Map
Nearby Homes
- 1836 105th St
- 207 1st St N
- 106 Madison St S
- 104 Monroe St S
- 701 Christians Trail
- 1894 105th St
- 00 Q Ave
- 0 Q Ave
- 203 6th St
- 201 Westline Dr
- 306 S 4th St
- 0 S Frederick & Wildwood Ln Unit NBR20254283
- 106 S 3rd St
- 203 & 205 Grove St
- 410 Lakeside Dr
- 1128 1st Ave SW
- 973 S Frederick Ave
- 919 1st Ave SE
- 825 1st Ave SW
- 305 8th Ave SW
- 1535 120th St
- 1569 120th St
- 1218 Fairbank Amish Blvd
- 1273 Fairbank Amish Blvd
- 1495 120th St
- 1243 Fairbank Amish Blvd
- 1146 Fairbank Amish Blvd
- 1125 Fairbank Amish Blvd
- 1603 120th St Unit 1605
- 1623 120th St
- 1616 120th St
- 1271 Fairbank Amish Blvd
- 1453 120th St
- 1450 120th St
- 1633 120th St
- 1564 110th St
- 1528 110th St
- 1583 110th St